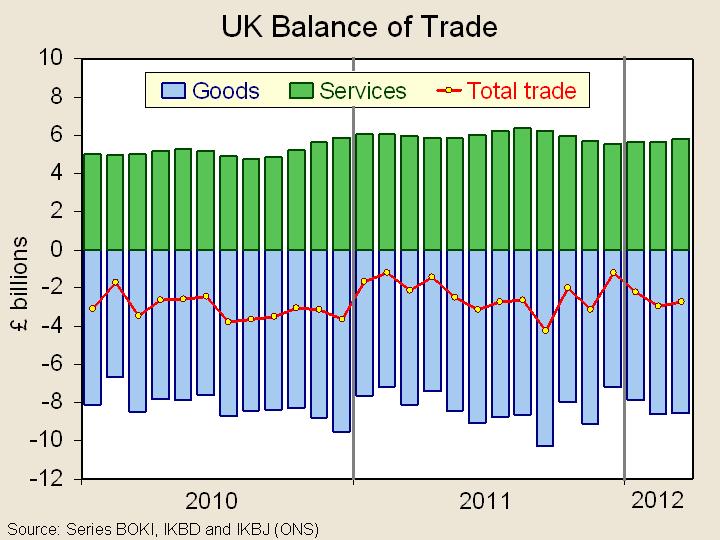
 The UK’s trade deficit narrowed in March to £2.74bn from £2.95bn in February. The goods deficit fell just slightly to £8.56bn from £8.59bn, but the services surplus rose more substantially to £5.83bn from £5.64bn.
So was this a sign of the UK economy’s relative weakness holding back the demand for imports? Or was it a sign of a recovering export sector, especially in services?
 And what of the coming months? What will be the effect of a growing crisis in the eurozone on (a) the sterling exchange rate, (b) the rate of economic growth outside the UK and (c) UK economic growth? And what will be the effect of these on the demand for imports and exports and on the trade balance? The following articles examine the issues.
(For a PowerPoint of the above chart, click on the following link: Balance of trade)
Articles
UK goods trade deficit stable as exports to non-EU countries rebound Reuters (15/5/12)
UK trade deficit narrows in March to £2.7bn BBC News (15/5/12)
Exports close UK trade deficit Guardian (15/5/12)
First trade surplus in cars since 1976 The Telegraph, Emma Rowley (15/5/12)
UK trade deficit narrows in March Fresh Business Thinking, Marcus Leach (15/5/12)
ONS Release
UK Trade, March 2012 ONS Release (15/5/12)
Questions
- Distinguish between the balance on trade in goods, the balance of trade and the balance on current account.
- Why did the UK’s trade deficit fall in March 2012?
- Why did the UK experience its first trade surplus in cars since 1976?
- What is likely to happen to the UK’s balance of trade in the coming months? How is the income elasticity of demand for UK exports and imports relevant to the answer?
- What has been happening recently to the sterling exchange rate? How will this impact on the UK’s balance of trade? How will the size of this impact depend on the price elasticity of demand and supply for imports and exports?
This autumn has been one of the mildest on record. Whilst this may be very nice for most of us, certain industries have been suffering. For example, gas and electricity consumption is down as people delay turning on their heating. One sector particularly badly hit has been clothing. Sales of winter clothes are substantially down and many retailers are longing for colder weather to boost their sales.
Of course, this is not helped by consumer incomes. With inflation at around 5% and average (pre-tax) weekly earnings currently rising by less than 2%, real incomes are falling. In fact over the year, even nominal disposable incomes are down 2.1%, given the rise in national insurance and income tax. And the problem of falling incomes is compounded by worries over the future state of the economy – whether it will go back into recession, with further falls in real income and rises in unemployment.
It’s no wonder that retailers are longing for some cold weather and for their customers to return from the seaside or their garden barbecues to the shopping malls. Look out for the ‘sales’ signs: they’re beginning to spring up as desperate retailers seek to attract wary customers.
Webcast
 Retailers slash prices in Christmas build-up BBC News, Tim Muffett (25/11/11)
Articles
Winter woes: warm weather means shoppers aren’t buying as much Guardian, Zoe Wood (21/11/11)
Shoppers urged to be savvy as Christmas sales last for weeks The Telegraph, Victoria Ward (21/11/11)
Data
Earnings tables: Labour Market Statistics ONS (November 2011)
Personal Income and Wealth ONS
Price Indices and Inflation ONS
Personal Inflation Calculator (PIC) ONS
Questions
- Identify the determinants of demand for winter clothing.
- How responsive is demand likely to be to these determinants (a) over a period of a few weeks; (b) over a period of a few months?
- What factors should a retailer take into account when deciding whether to make pre-Christmas discounts?
- Assume that you are employed but are afraid of losing your job in a few months’ time. How would this affect your consumption of (a) seasonal goods; (b) durable goods; (c) day-to-day goods?
- What longer-term strategies could retailers adopt if they predict tough trading conditions over the next two or three years?
With pressure on household incomes, many have had to forego spending on luxuries and travel is seen by many as just that – a luxury they can no longer afford. Add on to this some unexpected external shocks and it’s unsurprising to see a company such as Thomas Cook, the second largest holiday business in the world, in talks with banks. It provides some 19 million holidays per year, but has seen a relatively rapid deterioration in its finances.
Its debts total in September 2011 was some £900 million and the value of the company has declined significantly in recent times. However, the most notable decline has been since it emerged that Thomas Cook was in talks with its banks in preparation for tougher times to come. It is hoping to receive £100 million from a range of banks including HSBC and Lloyds, but on this news Thomas Cook share prices fell by some 75%. However, Thomas Cook has said that the company is simply requesting money as a cushion and that it is not in a desperate financial situation. As the Acting Chief Executive, Sam Weihagen said, ‘I think investors should have confidence in Thomas Cook’.
Many factors have contributed towards Thomas Cook’s current situation – volcanic ash clouds, political unrest and unkind weather, but also some internal strategic decisions, such as their continued focus on package holidays, despite the fact that data suggests 2 in 3 people that go to Spain (a popular package destination) are actually not on a typical package holiday. The key thing with travel is that it is very much based on confidence (as we have also seen with the banking sector). If confidence in a company declines, people stop booking holidays with them and so further financial issues are created. This issue is even more significant when a well known brand name, such as Thomas Cook is the company in trouble. Nothing else makes such great headlines as a well known brand in trouble. So, should holiday makers be concerned? The following articles consider the situation that Thomas Cook faces.
Thomas Cook makes it hard to see the funny side Telegraph, Alistair Osborne (22/11/11)
Thomas Cook dives on bank talks BBC News (22/11/11)
How Thomas Cook shares dive 75% on new of bank talks BBC News (22/11/11)
Thomas Cook reassures holiday makers after shares plunge Guardian, Simon Bowers and Patrick Collinson (22/11/11)
Thomas Cook risks customer exodus during bank talks after stock plunges Bloomberg, Armorel Kenna and David Altaner (23/11/11)
Fears for Thomas Cook after shares sink 75% Independent, James Thompson (23/11/11)
Thomas Cook shares crash after default warning Reuters, Matt Scuffham (22/11/11)
Questions
- Explain the reason why share prices have fallen for Thomas Cook. Use a diagram showing the demand and supply of shares to support your explanation.
- Distinguish between the internal and external factors that have contributed to Thomas Cook’s current position.
- Under which aspect of PEST and STEEPLE analysis would you place the above influences?
- In the Telegraph article, an industry source says: ‘In a business like this you need a very conservative capital structure because you don’t know what’s going to come and bite you.’ What is meant by ‘a very conservative capital structure’?
- What action can Thomas Cook take to try to improve its current financial position? Think about both costs and revenues.
- What type of good would you class a holiday as? Based on this, what sort of figure would you place on the income elasticity of demand for holidays?
- How likely do you think it is that other travel companies are also experiencing similar financial issues to Thomas Cook?
The price of petrol at the pumps has risen substantially over the past few years. In the UK, according to the AA, the average price between January and June 2011 was 133.13p. In the same period in 2010 it was 116.68p; and in the same period in 2008 it was 109.00p.
Over the first six months of 2011, the amount of petrol sold fell by 5.2 per cent. This was on top of the decline in consumption over the previous four years. Between 2006 and 2010 consumption of petrol fell by 17.4%. The consumption of petrol and diesel are given in the following table.
UK consumption of petrol and diesel (tonnes millions)
|
2006 |
2007 |
2008 |
2009 |
2010 |
| Petrol |
18.14 |
17.59 |
16.68 |
15.76 |
14.99 |
| Diesel |
20.15 |
21.07 |
20.61 |
20.06 |
20.87 |
| Total |
38.29 |
38.66 |
37.29 |
35.82 |
35.86 |
 The UK’s trade deficit narrowed in March to £2.74bn from £2.95bn in February. The goods deficit fell just slightly to £8.56bn from £8.59bn, but the services surplus rose more substantially to £5.83bn from £5.64bn.