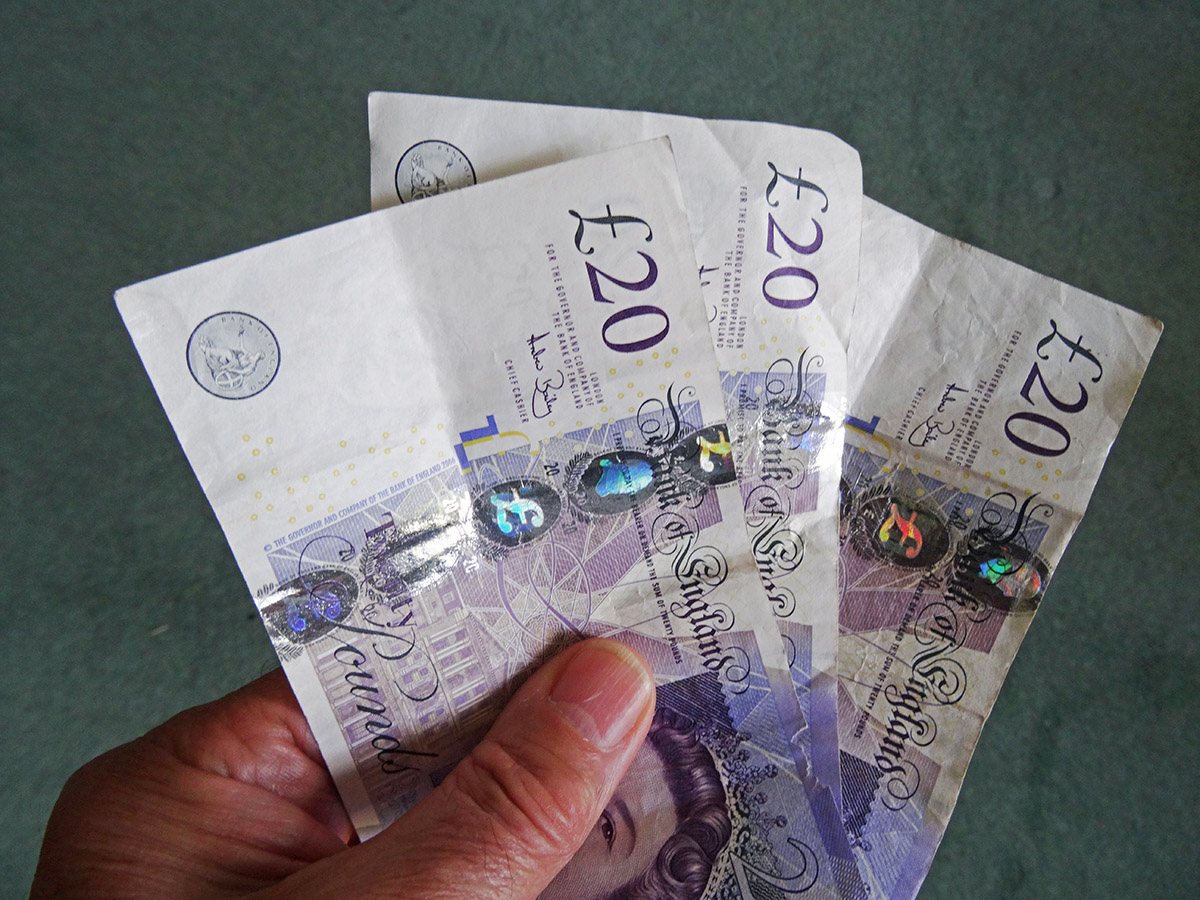
 Would you like to be a millionaire? Of course you would – who wouldn’t, right? Actually the answer to this question may be more complicated than you might think (see for instance Sgroi et al (2017) on the economics of happiness: see linked article below), but, generally speaking, most people would answer positively to this question.
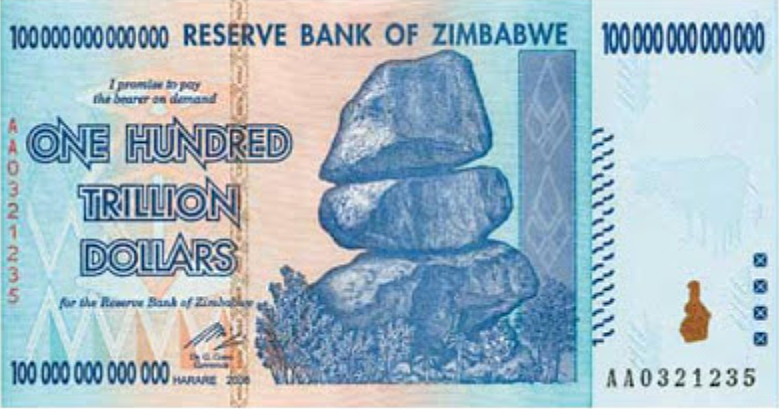
What if I told you, however, that you could become a millionaire (actually, scratch that – think big – make that “trillionaire”) overnight and be deeply unhappy about it? If you don’t believe me see what happened to Zimbabwe 10 years ago, when irresponsible money printing and fiscal easing drove the country’s economy to staggering hyperinflation (see the blogs A remnant of hyperinflation in Zimbabwe and Fancy a hundred trillion dollar note?. At the peak of the crisis, prices were increasing by a factor of 130 each year. I have in my office a 100 trillion Zimbabwean dollar note (see below) which I show in my lectures when I talk about hyperinflation to my first year Economics for Business students (if you are one of them, make sure not to miss it next February at UEA!). How much is this 100 trillion note worth? Nothing (except, may be, for collectors). It has been withdrawn from circulation as it ended up not even being worth the cost of the paper on which it was printed.
The Zimbabwean economy managed to pull itself out of this spiral of economic death, partly by informally replacing its hyperinflationary currency with the US greenback, and partly by keeping its fiscal spending under control and reverting to more sane economic policy making. That lasted until 2013, after which the government launched a Zimbabwean digital currency (known as “Zollar”) that had a nominal value set equal to a US dollar; and forced its exporters to exchange their greenbacks for Zollars. It then started spending these USD to finance a very ambitious and unsustainable programme of fiscal expansion.
The Economist published yesterday a story that shows the results of this policy – wild price increases and empty supermarket shelves are both back. According to the newspaper’s report:
At a supermarket in Harare, Zimbabwe’s capital, the finance minister is staring aghast at a pack of nappies. ‘This is absolutely ridiculous!’, exclaims Mthuli Ncube. ‘$49!’ A manager says it cost $23 two weeks ago, before pointing out other eye-watering items such as $20 Coco Pops. […] Over the past two weeks zollars have been trading at as little as 17 cents to the dollar. The devaluation has led to a surge in prices—and not just in imported goods like nappies. Football fans attending the Zimbabwe v Democratic Republic of Congo game on October 16th were shocked to learn that ticket prices had doubled on match day.
How long will it take for the 100 trillion Zollar to make its appearance again? We shall find out. I am sure Zimbabweans will be less than thrilled!
Articles and Report
- A fist full of zollars: Zimbabwe’s shops are empty and prices are soaring
The Economist (28/10/18)
- Shelves Empty as Specter of Hyperinflation Stalks Zimbabwe
Bloomberg, Paul Wallace, Godfrey Marawanyika and Desmond Kumbuka (12/10/18)
- imbabwe currency crisis: No cash, no bread, no KFC
BBC News, Andrew Harding (12/10/18)
- Hyperinflation in Zimbabwe: money demand, seigniorage and aid shocks
Journal of Applied Economics, Tara McIndoe-Calder (Volume 50, Issue 15, 18/9/17)
- Understanding Happiness
A CAGE Policy Report: Social Market Foundation, Daniel Sgroi, Thomas Hills, Gus O’Donnell, Andrew Oswald and Eugenio Proto (January 2017)
Videos
Questions
- Using an AS/AD diagram, explain the concept of hyperinflation. How can irresponsible fiscal policy-making lead to hyperinflation?
- What are the effects of hyperinflation on the people who live in the affected countries? Search the web for examples and case studies, and use them to support your answer.
- Once it has started, what policies can be used to fight hyperinflation? Use examples to support your answer.
- How does speculation affect hyperinflation?
 The IMF has just published its six-monthly World Economic Outlook. This provides an assessment of trends in the global economy and gives forecasts for a range of macroeconomic indicators by country, by groups of countries and for the whole world.
This latest report is upbeat for the short term. Global economic growth is expected to be around 3.9% this year and next. This represents 2.3% this year and 2.5% next for advanced countries and 4.8% this year and 4.9% next for emerging and developing countries. For large advanced countries such rates are above potential economic growth rates of around 1.6% and thus represent a rise in the positive output gap or fall in the negative one.
But while the near future for economic growth seems positive, the IMF is less optimistic beyond that for advanced countries, where growth rates are forecast to decline to 2.2% in 2019, 1.7% in 2020 and 1.5% by 2023. Emerging and developing countries, however, are expected to see growth rates of around 5% being maintained.
For most countries, current favorable growth rates will not last. Policymakers should seize this opportunity to bolster growth, make it more durable, and equip their governments better to counter the next downturn.
By comparison with other countries, the UK’s growth prospects look poor. The IMF forecasts that its growth rate will slow from 1.8% in 2017 to 1.6% in 2018 and 1.5% in 2019, eventually rising to around 1.6% by 2023. 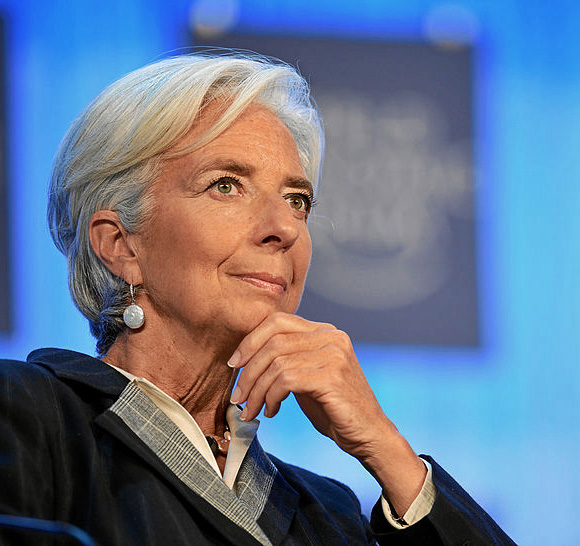 The short-term figures are lower than in the USA, France and Germany and reflect ‘the anticipated higher barriers to trade and lower foreign direct investment following Brexit’.
The report sounds some alarm bells for the global economy.
The first is a possible growth in trade barriers as a trade war looms between the USA and China and as Russia faces growing trade sanctions. As Christine Lagarde, managing director of the IMF told an audience in Hong Kong:
Governments need to steer clear of protectionism in all its forms. …Remember: the multilateral trade system has transformed our world over the past generation. It helped reduce by half the proportion of the global population living in extreme poverty. It has reduced the cost of living, and has created millions of new jobs with higher wages. …But that system of rules and shared responsibility is now in danger of being torn apart. This would be an inexcusable, collective policy failure. So let us redouble our efforts to reduce trade barriers and resolve disagreements without using exceptional measures.
 The second danger is a growth in world government and private debt levels, which at 225% of global GDP are now higher than before the financial crisis of 2007–9. With Trump’s policies of tax cuts and increased government expenditure, the resulting rise in US government debt levels could see some fiscal tightening ahead, which could act as a brake on the world economy. As Maurice Obstfeld , Economic Counsellor and Director of the Research Department, said at the Press Conference launching the latest World Economic Outlook:
Debts throughout the world are very high, and a lot of debts are denominated in dollars. And if dollar funding costs rise, this could be a strain on countries’ sovereign financial institutions.
In China, there has been a massive rise in corporate debt, which may become unsustainable if the Chinese economy slows. Other countries too have seen a surge in private-sector debt. If optimism is replaced by pessimism, there could be a ‘Minsky moment’, where people start to claw down on debt and banks become less generous in lending. This could lead to another crisis and a global recession. A trigger could be rising interest rates, with people finding it hard to service their debts and so cut down on spending.
The third danger is the slow growth in labour productivity combined with aging populations in developed countries. This acts as a brake on growth. The rise in AI and robotics (see the post Rage against the machine) could help to increase potential growth rates, but this could cost jobs in the short term and the benefits could be very unevenly distributed.
 This brings us to a final issue and this is the long-term trend to greater inequality, especially in developed economies. Growth has been skewed to the top end of the income distribution. As the April 2017 WEO reported, “technological advances have contributed the most to the recent rise in inequality, but increased financial globalization – and foreign direct investment in particular – has also played a role.”
And the policy of quantitative easing has also tended to benefit the rich, as its main effect has been to push up asset prices, such as share and house prices. Although this has indirectly stimulated the economy, it has mainly benefited asset owners, many of whom have seen their wealth soar. People further down the income scale have seen little or no growth in their real incomes since the financial crisis.
Articles
- Clouds gather over global economy, casting long shadow on Europe
Politico, Pierre Briançon (18/4/18)
- IMF warns rising trade tensions threaten to derail global growth
Reuters, David Lawder (17/4/18)
- IMF outlook contains cause for celebration but a horrendous hangover is looming
The Guardian, Greg Jericho (18/4/18)
- World trade system in danger of being torn apart, warns IMF
The Guardian, Larry Elliott (17/4/18)
- IMF Warns of Rising Threats to Global Financial System
Bloomberg, Andrew Mayeda (18/4/18)
- IMF issues warning on global debt
BBC News, Andrew Walker (18/4/18)
- The IMF has a simple message: the global recovery will peter out
The Guardian, Larry Elliott (17/4/18)
- Global growth is built, alas, on shaky foundations
The Irish Times, Martin Wolf (18/4/18)
- Government debt
The Economist (19/4/18)
- This Is How Much Money the World Owes
Fortune (19/4/18)
Report
Data
Questions
- For what reasons may the IMF forecasts turn out to be incorrect?
- Why are emerging and developing countries likely to experience faster rates of economic growth than advanced countries?
- What are meant by a ‘positive output gap’ and a ‘negative output gap’? What are the consequences of each for various macroeconomic indicators?
- Explain what is meant by a ‘Minsky moment’. When are such moments likely to occur? Explain why or why not such a moment is likely to occur in the next two or three years?
- For every debt owed, someone is owed that debt. So does it matter if global public and/or private debts rise? Explain.
- What have been the positive and negative effects of the policy of quantitative easing?
- What are the arguments for and against using tariffs and other forms of trade restrictions as a means of boosting a country’s domestic economy?
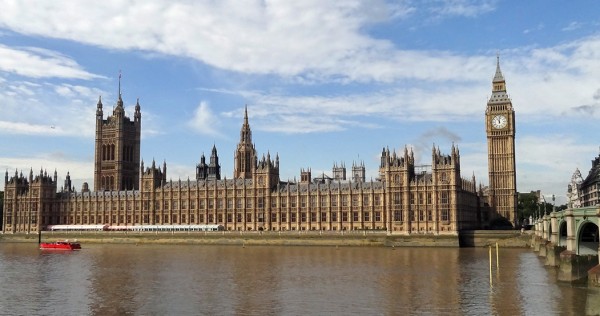 The last two weeks have been quite busy for macroeconomists, HM Treasury staff and statisticians in the UK. The Chancellor of the Exchequer, Mr Phillip Hammond, delivered his (fairly upbeat) Spring Budget Statement on 13 March, highlighting among other things the ‘stellar performance’ of UK labour markets. According to a Treasury Press Release:
Employment has increased by 3 million since 2010, which is the equivalent of 1,000 people finding work every day. The unemployment rate is close to a 40-year low. There is also a joint record number of women in work – 15.1 million. The OBR predict there will be over 500,000 more people in work by 2022.
To put these figures in perspective, according to recent ONS estimates, in January 2018 the rate of UK unemployment was 4.3 per cent – down from 4.4 per cent in December 2017. This is the lowest it has been since 1975. This is of course good news: a thriving labour market is a prerequisite for a healthy economy and a good sign that the UK is on track to full recovery from its 2008 woes.
The Bank of England welcomed the news with a mixture of optimism and relief, and signalled that the time for the next interest rate hike is nigh: most likely at the next MPC meeting in May.
But what is the practical implication of all this for UK consumers and workers?
For workers it means it’s a ‘sellers’ market’: as more people get into employment, it becomes increasingly difficult for certain sectors to fill new vacancies. This is pushing nominal wages up. Indeed, UK wages increased on average by 2.6 per cent year-to-year.
In real terms, however, wage growth has not been high enough to outpace inflation: real wages have fallen by 0.2 per cent compared to last year. Britain has received a pay rise, but not high enough to compensate for rising prices. To quote Matt Hughes, a senior ONS statistician:
Employment and unemployment levels were both up on the quarter, with the employment rate returning to its joint highest ever. ‘Economically inactive’ people — those who are neither working nor looking for a job — fell by their largest amount in almost five and a half years, however. Total earnings growth continues to nudge upwards in cash terms. However, earnings are still failing to outpace inflation.
An increase in interest rates is likely to put further pressure on indebted households. Even more so as it coincides with the end of the five-year grace period since the launch of the 2013 Help-to-Buy scheme, which means that many new homeowners who come to the end of their five year fixed rate deals, will soon find themselves paying more for their mortgage, while also starting to pay interest on their Help-to-buy government loan.
Will wages grow fast enough in 2018 to outpace inflation (and despite Brexit, which is now only 12 months away)? We shall see.
Articles
Data, Reports and Analysis
Questions
- What is monetary policy, and how is it used to fine tune the economy?
- What is the effect of an increase in interest rates on aggregate demand?
- How optimistic (or pessimistic) are you about the UK’s economic outlook in 2018? Explain your reasoning.
 These are challenging times for business. Economic growth has weakened markedly over the past 18 months with output currently growing at an annual rate of around 1.5 per cent, a percentage point below the long-term average. Spending power continues to be squeezed, with the annual rate of inflation in October reported to be running at 3.1 per cent compared to annual earnings growth of 2.5 per cent (see the squeeze continues). Moreover, consumer confidence remains fragile with households continuing to express particular concerns about the general economy and unemployment.
Here, we update our blog of July 2016 which, following the UK vote to leave the European Union, noted the fears for UK growth as confidence fell sharply. Consumer confidence is frequently identified by macro-economists as an important source of economic volatility. Indeed many macro models use a change in consumer confidence as a means of illustrating how economic shocks affect a range of macro variables, including growth, employment and inflation. Many economists agree that, in the short term at least, falling levels of confidence adversely affect activity because aggregate demand falls as households spend less.
The European Commission’s confidence measure is collated from questions in a monthly survey. In the UK around 2000 individuals are surveyed. Across the EU as a whole over 41 000 people are surveyed. In the survey individuals are asked a series of 12 questions which are designed to provide information on spending and saving intentions. These questions include perceptions of financial well-being, the general economic situation, consumer prices, unemployment, saving and the undertaking of major purchases.
The responses elicit either negative or positive responses. For example, respondents may feel that over the next 12 months the financial situation of their household will improve a little or a lot, stay the same or deteriorate a little or a lot. A weighted balance of positive over negative replies can be calculated. The balance can vary from -100, when all respondents choose the most negative option, to +100, when all respondents choose the most positive option.
The European Commission’s principal consumer confidence indicator is the average of the balances of four of the twelve questions posed: the financial situation of households, the general economic situation, unemployment expectations (with inverted sign) and savings, all over the next 12 months. These forward-looking balances are seasonally adjusted. The aggregate confidence indicator is thought to track developments in households’ spending intentions and, in turn, likely movements in the rate of growth of household consumption.
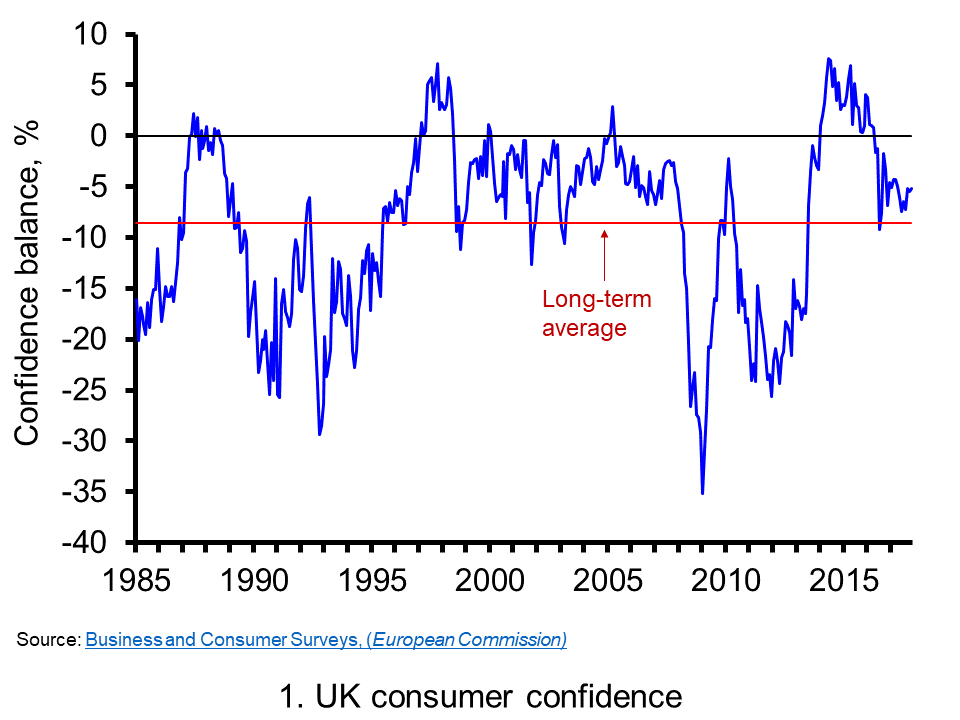
Chart 1 shows the consumer confidence indicator for the UK. The long-term average of –8.6 shows that negative responses across the four questions typically outweigh positive responses. In November 2017 the confidence balance stood at -5.2 roughly on par with its value in the previous two months, though marginally up on values of close to -7 over the summer. However, as recently as the beginning of 2016 the aggregate confidence score was running at around +4. In this context, current levels do constitute a significant change in consumer sentiment, changes which do ordinarily mark similar turning points in economic activity.(Click here to download a PowerPoint of the chart.)
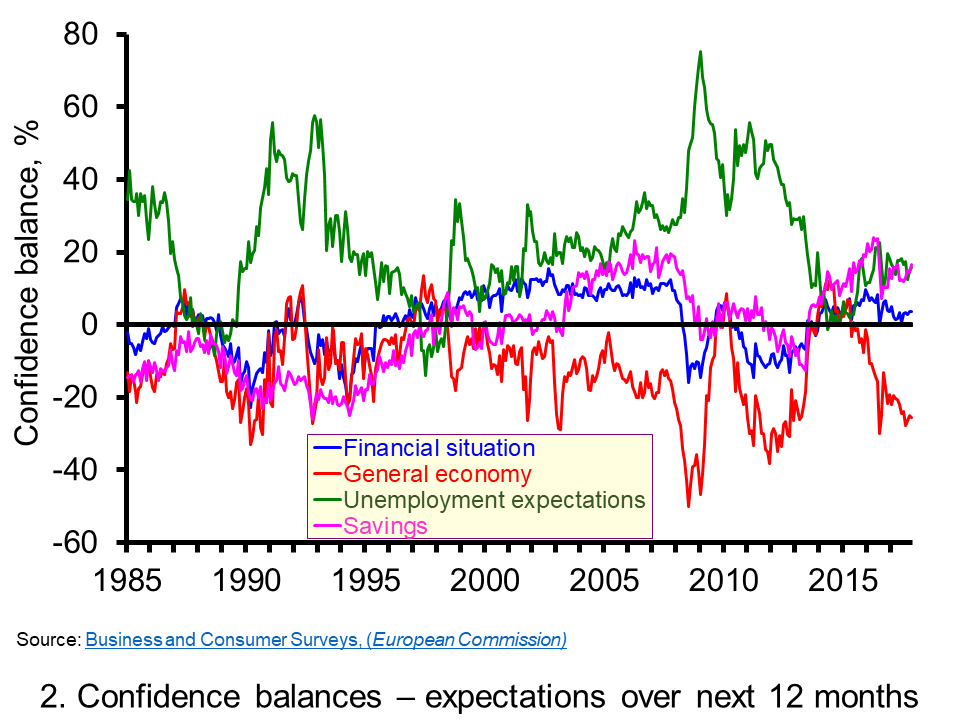
Chart 2 allows to look behind the European Commission’s headline confidence indicator for the UK by looking at its four component balances. From it, we can see a deterioration in all four components. However, by far the most significant change in the individual confidence balances has been the sharp deterioration in expectations for the general economy. In November the forward-looking general economic situation stood at -25.5, compared to its long-run average of -11.6. (Click here to download a PowerPoint of the chart.)
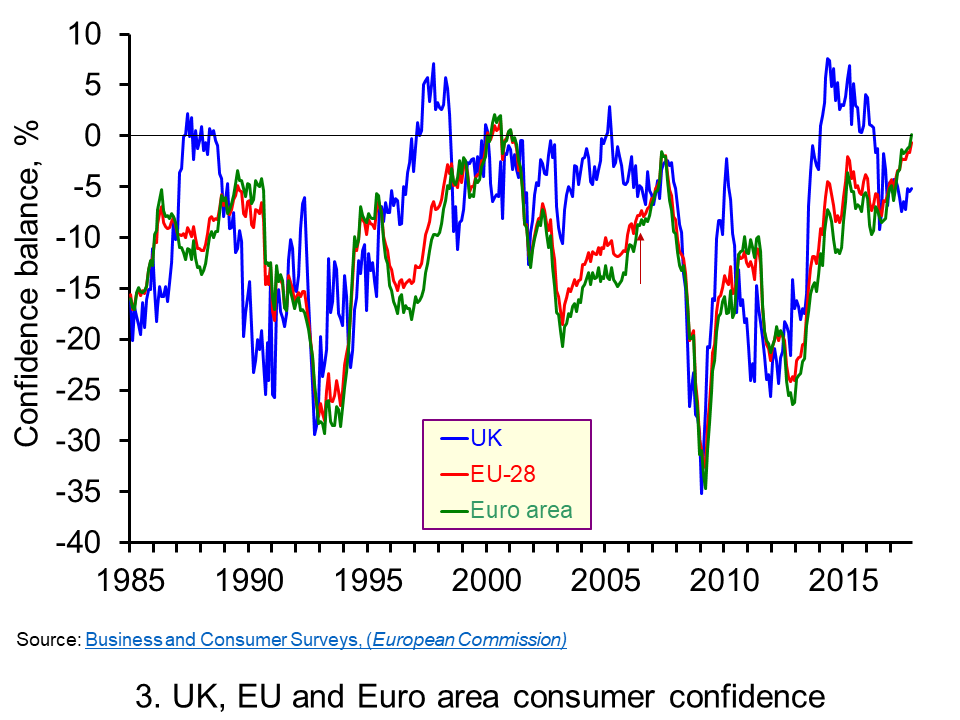 The fall in UK consumer confidence is even more stark when compared to developments in consumer confidence across the whole of the European Union and in the 19 countries that make up the Euro area. Chart 3 shows how UK consumer confidence recovered relatively more strongly following the financial crisis of the late 2000s. The headline confidence indicator rose strongly from the middle of 2013 and was consistently in positive territory during 2014, 2015 and into 2016. The fall in consumer confidence in the UK has seen the headline confidence measure fall below that for the EU and the euro area. (Click here to download a PowerPoint of the chart.)
Consumer (and business) confidence is closely linked to uncertainty. The circumstances following the UK vote to leave the EU have undoubtedly created the conditions for acute uncertainty. Uncertainty breeds caution. Economists sometimes talk about spending being affected by two conflicting motives: prudence and impatience. While impatience creates a desire for spending now, prudence pushes us towards saving and insuring ourselves against uncertainty and unforeseen events. The worry is that the twin forces of fragile confidence and squeezed real earning are weighting heavily in favour of prudence and patience (a reduction in impatience). Going forward, this could create the conditions for a sustained period of subdued growth which, if it were to impact heavily on firms’ investment plans, could adversely impact on the economy’s productive potential. The hope is that the Brexit negotiations can move apace to reduce uncertainty and limit uncertainty’s adverse impact on economic activity.
Articles
UK consumer confidence slips in December – Thomson Reuters/Ipsos Reuters (14/12/17)
UK consumer confidence drops to lowest level since Brexit result Independent, Ben Chu (30/11/17)
2017 set to be worst year for UK consumer spending since 2012, Visa says Independent, Josie Cox, (11/12/17)
Carpetright boss warns of ‘fragile’ consumer confidence after profits plunge Telegraph, Jack Torrance (12/12/17)
UK consumers face sharpest price rise in services for nearly a decade Guardian, Richard Partington (5/12/17)
UK average wage growth undershoots inflation again squeezing real incomes Independent, Josie Cox (13/12/17)
Bank sees boost from Brexit progress BBC News (14/12/17)
Data
Business and Consumer Surveys European Commission
Questions
- Draw up a series of factors that you think might affect consumer confidence.
- Explain what you understand by a positive and a negative demand-side shock. How might changes in consumer confidence generate demand shocks?
- Analyse the ways in which consumer confidence might affect economic activity.
- Which of the following statements is likely to be more accurate: (a) Consumer confidence drives economic activity or (b) Economic activity drives consumer confidence?
- What macroeconomic indicators would those compiling the consumer confidence indicator expect the indicator to predict?
- Analyse the possible short-term and longer-term economic implications of a fall in consumer confidence.
- How might uncertainty affect consumer confidence?
- What do the concepts of impatience and prudence mean in the context of consumer spending? When consumer confidence falls which of these might become more significant for consumer spending?
UK CPI inflation rose to 3.1% in November. This has forced Mark Carney to write a letter of explanation to the Chancellor – something he is required to do if inflation is more than 1 percentage point above (or below) the target of 2%.
The rise in inflation over the past few months has been caused largely by the depreciation of sterling following the Brexit vote. But there have been other factors at play too. The dollar price of oil has risen by 32% over the past 12 months and there have been large international rises in the price of metals and, more recently, in various foodstuffs. For example, butter prices have risen by over 20% in the past year (although they have declined somewhat recently). Other items that have seen large price rises include books, computer games, clothing and public transport.
The rate of CPI inflation is the percentage increase in the consumer prices index over the previous 12 months. When there is a one-off rise in prices, such as a rise in oil prices, its effect on inflation will only last 12 months. After that, assuming the price does not rise again, there will be no more effect on inflation. The CPI will be higher, but inflation will fall back. The effect may not be immediate, however, as input price changes take a time to work through supply chains.
Given that the main driver of inflation has been the depreciation in sterling, once the effect has worked through in terms of higher prices, inflation will fall back. Only if sterling continued depreciating would an inflation effect continue. So, many commentators are expecting that the rate on inflation will soon begin to fall.
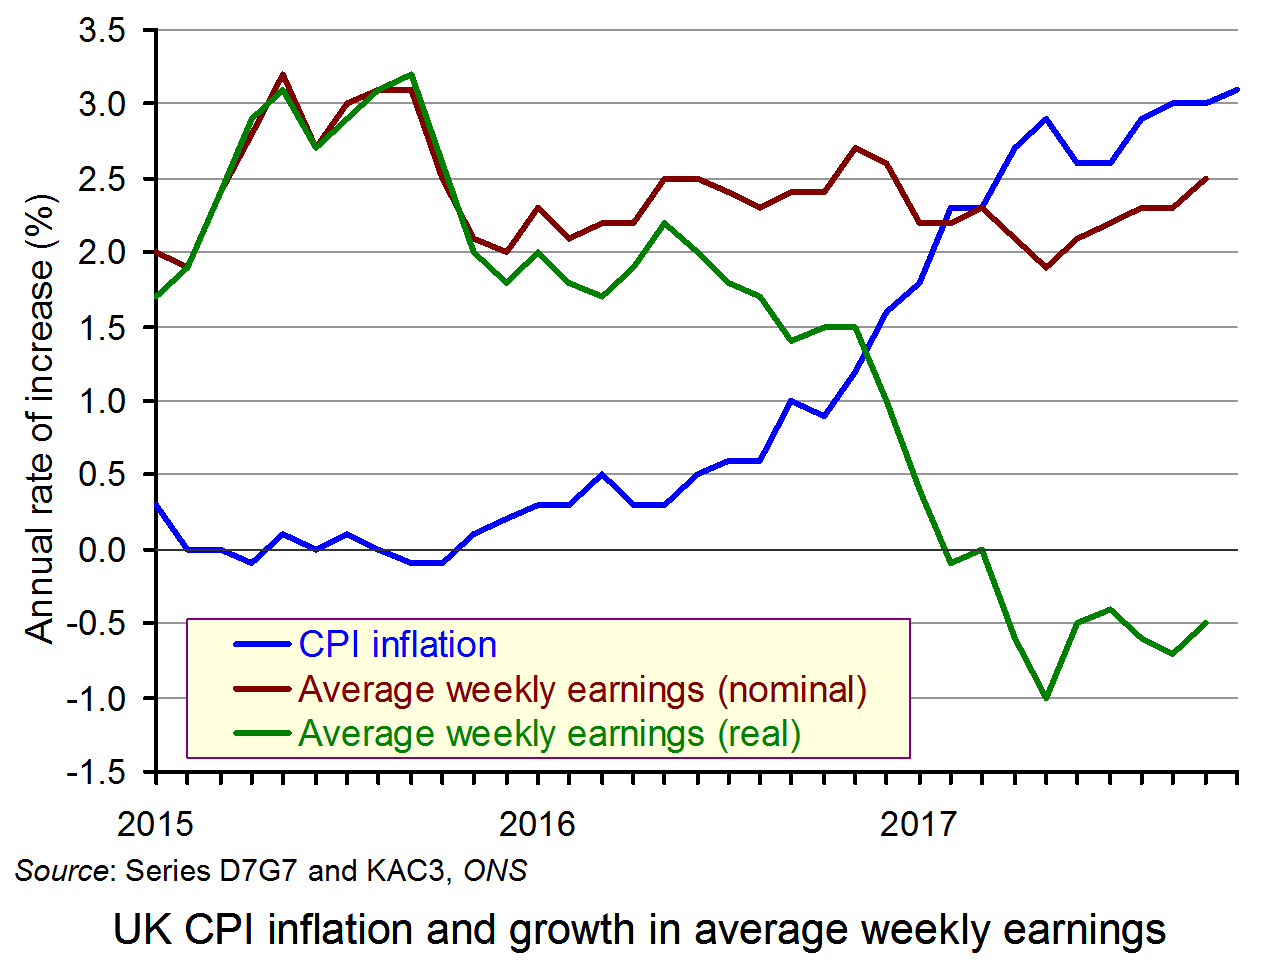 But what will have been the effect on real incomes? In the past 12 months, nominal average earnings have risen by around 2.5% (the precise figures will not be available for a month). This means that real average earnings have fallen by around 0.6%. (Click here for a PowerPoint of the chart.)
For many low-income families the effect has been more severe. Many have seen little or no increase in their pay and they also consume a larger proportion of items whose prices have risen by more than the average. Those on working-age benefits will be particularly badly hit as benefits have not risen since 2015.
If inflation does fall and if real incomes no longer fall, people will still be worse off unless real incomes rise back to the levels they were before they started falling. That could be some time off.
Articles
UK inflation rate at near six-year high BBC News (12/12/17)
Inflation up as food costs jump – and gas crisis threatens worse to come The Telegraph, Tim Wallace (12/12/17)
UK worst for pay growth as rich world soars ahead in 2018 The Telegraph, Tim Wallace (12/12/17)
Inflation rises to 3.1%, adding to UK cost of living squeeze The Guardian, Larry Elliott (12/12/17)
UK inflation breaches target as it climbs to 3.1% Financial Times, Gavin Jackson (12/12/17)
Inflation surges to 3.1% in November, a near six-year high Belfast Telegraph (12/12/17)
Data
CPI annual rate of increase (all items) ONS: series D7G7
Average weekly earnings, annual (3-month average) ONS: series KAC3
UK consumer price inflation: November 2017 ONS Statistical Bulletin (12/12/17)
Commodity prices Index Mundi
Questions
- Apart from CPI inflation, what other measures of inflation are there? Explain their meaning.
- Why is inflation of 2%, rather than 0%, seen as the optimal rate by most central banks?
- Apart from the depreciation of sterling, what other effects is Brexit likely to have on living standards in the UK?
- What are the arguments for and against the government raising benefits by the rate of CPI inflation?
- If Europe and the USA continue to grow faster than the UK, what effect is this likely to have on the euro/pound and dollar/pound exchange rates? What determines the magnitude of this effect?
- Unemployment is at its lowest level since 1975. Why, then, are real wages falling?
- Why, in the light of inflation being above target, has the Bank of England not raised Bank Rate again in December (having raised it from 0.25% to 0.5% in November)?
 Zimbabwe on brink of economic collapse