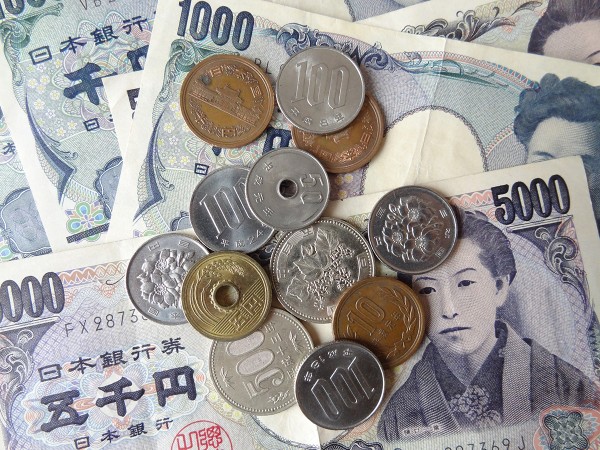
 Rising inflation: not normally a cause for celebration, but that’s not the case for Japan. Having been subject to the spectre of deflation for many years, the 22-year high for the CPI at 2.7% is a welcome figure, even it is slightly lower than expected. This surge in prices is partly the result of a growth in domestic demand and a sign, therefore, that output will expand in response to the rise in demand.
The Japanese economy has experienced largely stagnant growth for two decades and a key cause has been falling prices. Although consumers like bargains, this has been problematic for this large economy. Deflation creates continuously falling prices and this means consumers hold back from purchasing durable goods, preferring to wait until prices have fallen further.

In the blog, Japan’s recovery, we looked at inflation data showing Japanese consumer prices growing at a faster rate than expected. This ‘positive’ trend has continued.
When it comes to inflation, expectations are crucial. If people think prices will rise in the future, they are more likely to buy now to get the lower price. This can therefore help to stimulate aggregate demand and it is this that has been the target for Japan. Part of the growth in the CPI is down to the sales tax rise from 5% to 8%. This was the first time in 17 years that the sales tax had increased. Further increases in it are expected in 2015. There were concerns about the impact of this rise, based on the depression that followed the last rise back in 1997, but so far the signs seem good.
Monetary easing was a key component in ending the downward trajectory of the Japanese economy and, following the sales tax rise, many believe that another round of monetary easing may be needed to counter the effects and create further growth in the economy and in the CPI. As the Bank of Japan Governor said:
There are various ways to adjust policy. We will decide what among these measures is appropriate depending on economic and price developments at the time … For now, we can say Japan is making steady progress toward achieving 2 per cent inflation.
One of the ‘three arrows‘ of the government’s policy has been to boost government spending, which should directly increase aggregate demand. Furthermore, with signs of the CPI rising, consumers may be encouraged to spend more, giving a much needed boost to consumption. The economy is certainly not out of the woods, but appears to be on the right path. The following articles consider the Japanese economy.
Japan CPI rises less than expected Wall Street Journal, Takashi Nakamichi (25/4/14)
Japan inflation may beat BOJ forecast Reuters, Leika Kihara (22/4/14)
Tokyo consumer price growth at 22-year high BBC News (25/4/14)
Japan inflation quickens to over 5-year high, output rebounds Reuters, Leika Kihara and Stanley White (31/1/14)
Japan’s consumer inflation set to reach five-year high Guardian (18/4/14)
Tokyo inflation hits 22-year high, inching toward BOJ goal Reuters, Tetsushi Kajimoto and Leika Kihara (25/4/14)
Tokyo’s core CPI got 2.7% lift in April from tax hike The Japan Times (25/4/14)
Is Japan winning the war against deflation? CNBC, Ansuya Harjani (25/4/14)
Questions
- Why is deflation a problem?
- Using an AD/AS diagram, illustrate the problem of expectations and how this contributes to stagnant growth.
- Use the same diagram to explain how expectations of rising prices can help to boost AD.
- Why is the sales tax expected to reduce growth?
- Why is another round of monetary easing expected?
- What government policies would you recommend to a government faced with stagnant growth and falling prices?
 GDP is still the most frequently used indicator of a country’s development. When governments target economic growth as a key goal, it is growth in GDP to which they are referring. And they often make the assumption that growth in GDP is a proxy for growth in well-being. But is it time to leave GDP behind as the main indicator of national economic success? This is the question posed in the first of the linked articles below, from the prestigious science journal Nature.
As the article states:
Robert F. Kennedy once said that a country’s gross domestic product (GDP) measures “everything except that which makes life worthwhile”. The metric was developed in the 1930s and 1940s amid the upheaval of the Great Depression and global war. Even before the United Nations began requiring countries to collect data to report national GDP, Simon Kuznets, the metric’s chief architect, had warned against equating its growth with well-being.
GDP measures mainly market transactions. It ignores social costs, environmental impacts and income inequality. If a business used GDP-style accounting, it would aim to maximize gross revenue — even at the expense of profitability, efficiency, sustainability or flexibility. That is hardly smart or sustainable (think Enron). Yet since the end of the Second World War, promoting GDP growth has remained the primary national policy goal in almost every country
So what could replace GDP, or be considered alongside GDP? Should we try to measure happiness? After all, behavioural scientists are getting much better at  understanding and measuring the psychology of human well-being (see the blog posts Money can’t buy me love and Happiness economics).
Or should we focus primarily on long-term issues of the sustainability of development? Or should we focus more on the distribution of income or well-being in a world that is becoming increasingly unequal?
Or should measures of well-being involve weighted composite indices involving things such as life-expectancy, education, housing, democratic engagement, leisure time, social mobility, etc. And, if so, how should the weightings of the different indicators be determined? The United Nations Development Programme (UNDP) produces annual Human Development Reports, where countries are ranked according to a Human Development Index. As the UNDP site states:
The breakthrough for the HDI was the creation of a single statistic which was to serve as a frame of reference for both social and economic development. The HDI sets a minimum and a maximum for each dimension, called goalposts, and then shows where each country stands in relation to these goalposts, expressed as a value between 0 and 1.
HDI is a composite of three sets of indicators: education, life expectancy and income (see). The UNDP since 2010 has also produced an Inequality-adjusted HDI (IHDI).
The IHDI will be equal to the HDI value when there is no inequality, but falls below the HDI value as inequality rises. The difference between the HDI and the IHDI represents the ‘loss’ in potential human development due to inequality and can be expressed as a percentage.
You can now build your own HDI for each country on the UNDP site by selecting from the following indicators: health, education, income, inequality, poverty and gender.
The Nature article considers a number of measures of progress and considers their relative merits. The other articles also look at measuring national progress and well-being and at the relationship between income per head and happiness. It is clear that focusing on GDP alone provides too simplistic an approach to measuring development.
Development: Time to leave GDP behind Nature, Robert Costanza, Ida Kubiszewski, Enrico Giovannini, Hunter Lovins, Jacqueline McGlade, Kate E. Pickett, Kristín Vala Ragnarsdóttir, Debra Roberts, Roberto De Vogli and Richard Wilkinson (15/1/14)
The happiness agenda makes for miserable policy The Conversation, Daniel Sage (9/1/14)
Economic view: No matter what the politicians say, GDP is a distorted guide to economic performance and a bad way to measure prosperity Independent, Guy Hands (28/1/14)
Buy buy love The Economist (22/6/13)
Experts confirm that money does buy happiness – but only up to £22,100 Independent, Jamie Merrill (28/11/13)
Can Money Buy Happiness? Scientific American, Sonja Lyubomirsky (10/8/10)
Money can buy happiness The Economist (2/5/13)
Money can buy happiness Hacker News, pyduan (13/1/14)
Can ‘happiness economics’ provide a new framework for development? The Guardian, Christian Kroll (3/9/13)
The 10 Things Economics Can Tell Us About Happiness The Atlantic, Derek Thompson (31/5/12)
Financial crisis hits happiness levels BBC News (3/11/13)
Happiness study finds that UK is passing point of peak life satisfaction The Guardian, Larry Elliott (27/11/13)
How GDP became the figure everyone wanted to watch BBC News, Peter Day (16/4/14)
Economic development can only buy happiness up to a ‘sweet spot’ of $36,000 GDP per person Science Daily (27/11/13)
Questions
- What does GDP measure?
- How suitable a measure of economic progress is growth in GDP?
- How can GDP be adjusted to make it a more suitable measure of economic progress?
- What are the advantages of using composite indicators of well-being?
- What difficulties are there in measuring well-being using composite indicators?
- Assuming there were no measurement problems, what indicators would you include in devising the optimum composite indicator of well-being?
- Can money buy happiness?
- Why do life satisfaction levels peak at around $36,000 (adjusted for Purchasing Power Parity (PPP))?
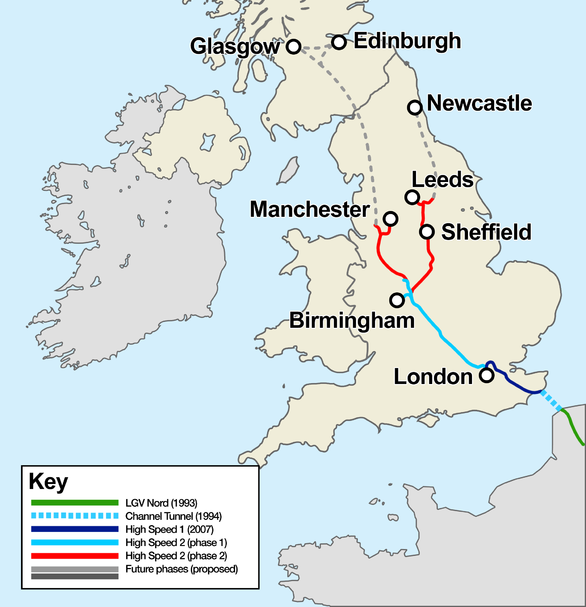
 HS2 has been a controversial topic for some time now. Between the disruption it would cause to countless neighbourhoods and the protests that have emerged and the debate about the cost effectiveness of the project, it’s been in the news a fair amount. The transport network in the UK needs improving, not only for businesses located here, but also to encourage more investment into the country. HS2 is one of the solutions offered.
The latest estimate for the cost of HS2 is over £40 billion. However, many suggest that the benefits HS2 will bring do not cover the full costs. Furthermore, as noted above, other concerns include the disruption that it will bring to countless households who will be living along the proposed routes. Cost benefit analysis have been carried out to determine the viability of the project, but they are invariably difficult to do. As they involve determining all of the private and social costs and benefits and putting a monetary estimate onto them, there will inevitably be factors that are over-looked, under-estimated or over-estimated. The suggestions here are that the costs have been under-estimated and the benefits over-estimated.
 In September, KPMG produced a report that estimated the overall benefit to the UK economy would be a boost to growth of 0.8%, which would benefit many businesses and communities. The British Chambers of Commerce said:
Business communities in dozens of cities and towns, from many parts of the UK, remain strongly supportive of HS2.
The railway network is also approaching full capacity and this is one of the reasons why HS2 has been proposed. A government source said:
We need to do something because our railways are nearly full, but the alternative to HS2 is a patch and mend job that would cause 14 years of gridlock, hellish journeys and rail replacement buses … The three main routes to the north would be crippled and the economy would be damaged.
However, this report has faced criticism, in particular because it ignored a variety of supply-side constraints and because they argue it would be more effective to simply update the existing network. 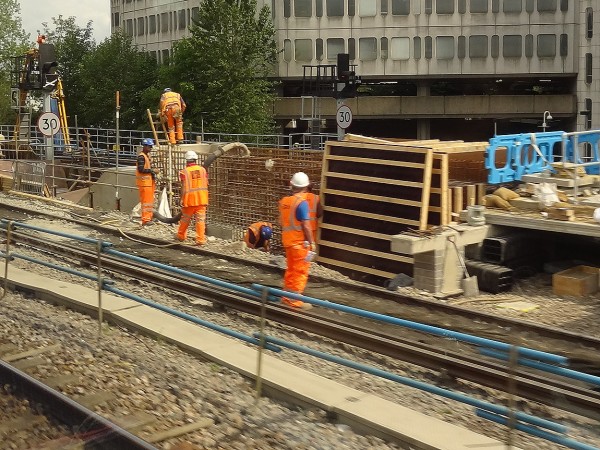 However, a new government-commissioned report has suggested that this alternative to HS2 would involve 14 years of weekend route closures and much longer journey times. However, those in favour of updating existing routes have said that this new report commissioned by the government is ‘a complete fabrication’. Hilary Wharf of the HS2 Action Alliance commented:
This government-funded report is a complete fabrication. The main alternative to HS2 involves longer trains and reduced first-class capacity to provide more standard class seats…No work is required at Euston to deliver the necessary capacity increase. Work is only required at three locations on the WCML [West Coast Main Line], and this is comparable to the work being carried out on the route at present.
The debate regarding HS2 will continue for the time being and it is just another area that is fuelling the political playing field. Whatever is done, the rail network certainly requires investment, whether it is through HS2 or upgrades to the existing routes. The following reports and articles consider the latest developments and controversy regarding HS2.
Reports
HS2 Cost and Risk model Report: A report to Government by HS2 ltd HS2 Ltd March 2012
High Speed 2 (HS2) Limited: HS2 Regional Economic Impacts KPMG September 2013
Draft Environmental Statement: Phase One: Engine for Growth HS2 May 2013
Updated Economic Case for HS2 HS2 August 2012
Articles
HS2 alternative ‘would mean years of rail disruption’ BBC News (28/10/13)
Alternative to HS2 would see Britain suffer 14 years of rail misery, says Coalition Independent, Nigel Morris (28/10/13)
HS2 alternatives could require 14 years of weekend rail closures The Guardian, Rajeev Syal (28/10/13)
Passengers ‘face 14 years of chaos if HS2 is derailed’: ‘Unattractive’ package of closures would be needed to expand capacity if Labour withdraws support Mail Online, Jason Groves (28/10/13)
HS2: Labour to examine cheaper rival plan The Telegraph, Tim Ross and Andrew Gilligan (27/10/13)
Britain’s railways have become mere outposts of other nations’ empires The Guardian, John Harris (28/10/13)
’Years of delays’ if government backs down on HS2 rail project Financial Times, Kiran Stacey and Brian Gloom (28/10/13)
Questions
- What is a cost-benefit analysis? Explain the steps that are involved in any cost-benefit analysis.
- Conduct a cost-benefit analysis for HS2. Ensure that you differentiate between costs and benefits and between private and social concepts.
- How can we measure the costs and benefits of HS2?
- Explain how HS2 is expected to boost economic growth. Use the AD/AS model to illustrate this.
- To what extent is there likely to be a multiplier effect from HS2? Is it likely to benefit the whole economy or just those areas where the route lies?
- Conduct a cost-benefit analysis for the alternative suggestion. Which do you think is likely to be more feasible? Explain your answer.
- How will improvements to the rail network or the investment of HS2 benefit businesses in the UK economy?
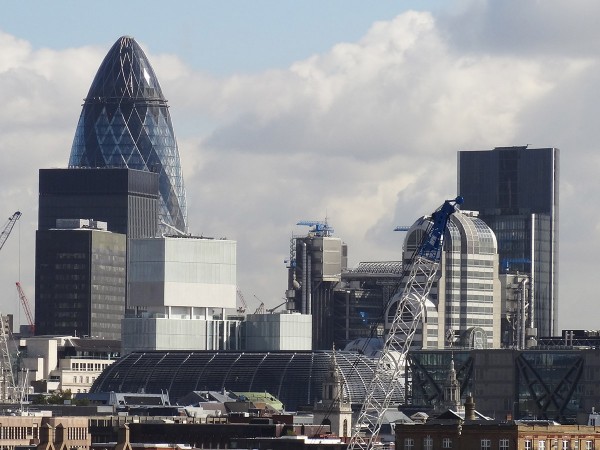 The Preliminary Estimate of the UK Q2 GDP figures by the Office for National Statistics show that the UK economy grew by 0.6% in the second quarter of 2013: double the growth rate of the first quarter and almost back to the long-run average growth rate prior to 2008.
At first sight, this would seem to be good news – certainly from the government’s point of view. What is more, unlike the previous quarter, growth is spread relatively evenly across the three main sectors: the production (manufacturing, mining, water supply, etc.) and services sectors both grew by 0.6% and the construction sector by 0.9% (this sector fell by 1.8% in the previous quarter). (Click here for a PowerPoint of the chart below.)
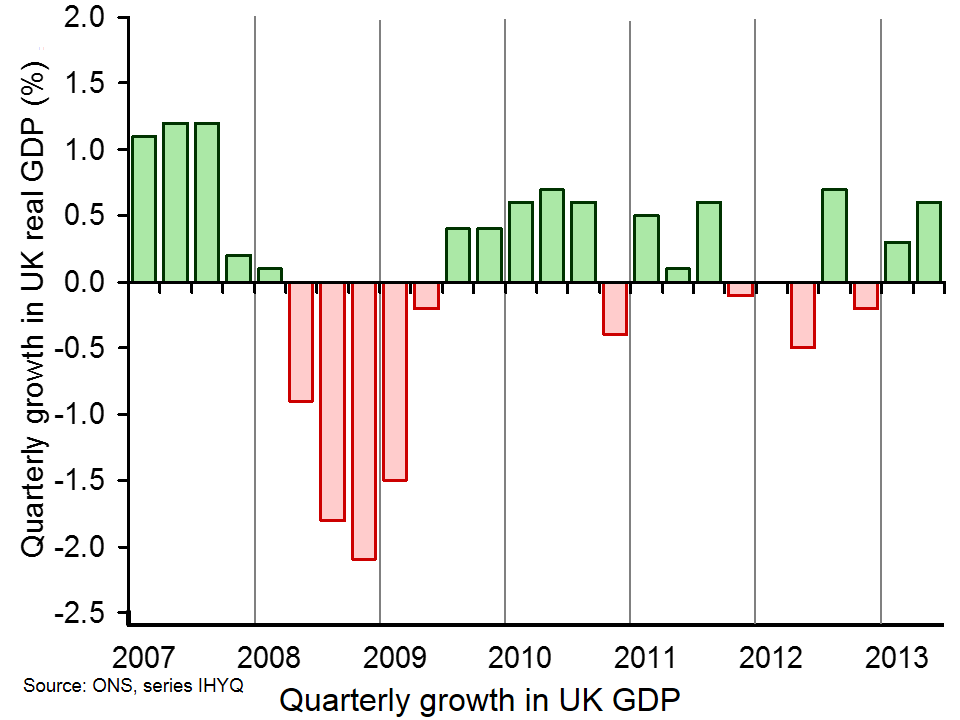 But while growth in the latest quarter may be balanced between the broad sectors, the rise in aggregate demand is not balanced between its components. As an earlier news item (A balancing act) showed, the rise in aggregate demand has been driven largely by a rise in consumption, and a corresponding fall in saving. Exports are rising only slowly and investment is some 25% lower than in the boom years prior to 2008.
So will the latest growth be sustainable? Will investment now begin to pick up and what constraints are there on investment? The following articles consider some of the issues.
Articles
Economy firing on all cylinders as growth hits 0.6pc The Telegraph, Philip Aldrick (25/7/13)
The good, the bad or the ugly? How the UK economy stands up. The Telegraph, Philip Aldrick (25/7/13)
George Osborne’s 0.6% growth is good but unspectacular The Guardian, Larry Elliott (25/7/13)
The (not-so) green shoots of recovery The Economist, John Van Reenen (23/7/13)
Economic recovery slow to take root for some in UK Reuters, William Schomberg and Max De Haldevang (25/7/13)
 GDP figures offer hard evidence for political narrative BBC News, Paul Mason (25/7/13)
Ignore the hype: Britain’s ‘recovery’ is a fantasy that hides our weakness The Observer, Will Hutton (21/7/13)
UK economy: Half-speed ahead BBC News, Stephanie Flanders (25/7/13)
BoE guidance can help sustain the UK recovery The Economist, Kevin Daly (22/7/13)
George Osborne’s description of the economy is near-Orwellian The Guardian, Ha-Joon Chang (26/7/13)
Economic growth: more must be done to encourage investment The Guardian, Phillip Inman (1/8/13)
Data
Gross Domestic Product: Preliminary Estimate, Q2 2013 ONS (25/7/13)
Questions
- Compare the macroeconomic situation today with that prior to the financial crisis of 2007/8 and subsequent recession.
- What factors will determine the sustainability of the UK economic recovery?
- What is meant by the ‘accelerator’ and what will determine the size of any accelerator effect from the latest rise in UK GDP?
- What supply-side constraints are likely to limit the rate and extent of recovery?
- Why do economies that are in recession ‘naturally bounce back’ without any government intervention? Have the macroeconomic policies of the UK government helped or hindered this bounce back? Explain.
- What monetary measures by the Bank of England are most appropriate in the current circumstances?
 In the blog The global economy we considered the economic performance of countries across the globe, including the UK. In the first estimate of UK economic growth for the first quarter of 2013, the economy grew at 0.3%, thus avoiding a triple-dip recession. This first estimate is always subject to change, but in this case, the data was confirmed.
The April 2013 figure provided by the ONS of 0.3% growth has been confirmed, once again indicating the slow recovery of the UK economy. Despite these more positive signs for the economy, the IMF has raised concerns of the weak performance of the UK and has urged the government to invest more in projects to stimulate growth. Although the economy has started to grow, economic growth has continued to remain weak since the onset of the financial crisis and recession. Martin Beck, an economist at Capital Economics said:
With employment and average earnings both dropping in the first quarter on their level in the previous quarter, the foundations for a sustained recovery, even one driven by consumers, still look pretty rickety.
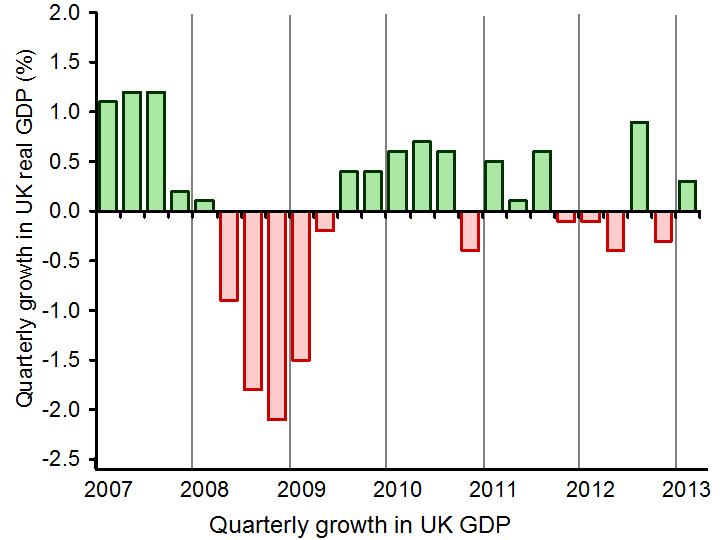 Initial estimates by the ONS are always updated and there is still time for the 0.3% growth figure to be changed, as more data becomes available. (Click here for a PowerPoint of the chart.) This latest figure, although unchanged, has given a more concrete indication of where the UK economy is continuing to struggle. Consumer spending increased by only 0.1%, investment and exports declined, but in further signs of a weak economy, the building up of stocks by companies was a big contributor to the UK economic growth – a contribution of 0.4 percentage points. The service sector continued to growth with a 0.6 percentage point contribution to GDP.
So, what does the future look like for the UK? Although the estimate of 0.3% figure did prevent a triple-dip recession and the IMF did comment on the ‘improving health’ of the economy, signs of recovery remain weak.
 Crucial to the recovery will be government spending, but more than this, the government spending must be in key growth industries. Data suggests that the UK invests less than other G8 countries as a percentage of GDP and this is perhaps one of the key factors that has prevented the UK recovery from gathering pace. The future of the UK economy remains uncertain and government policy will be crucial in determining this future course. The following articles consider the latest growth data.
Signs of weakness mar UK economic growth Reuters, Olesya Dmitracova and William Schomberg (23/5/13)
UK first quarter growth unchanged BBC News (23/5/13)
Concerns over underlying health of UK economy as 0.3% growth confirmed The Guardian, Philip Inman (23/5/13)
Statisticians confirm 0.3% UK growth for first quarter of 2013 Financial Times, Claire Jones and Sarah O’Connor (23/5/13)
UK GDP: concerns about underlying economy as 0.3pc growth confirmed The Telegraph, Philip Aldrick (23/5/13)
Britsh economy returns to growth in first quarter The Economic Times (23/5/13)
U.K. households not loosening purse strings Wall Street Journal, Ainsley Thomson and Ilona Bllington (23/5/13)
IMF: UK should push for economic growth BBC News (22/5/13)
Questions
- Why are numerous estimates of GDP made by the ONS?
- How is GDP measured? Is it an accurate measure of economic growth? What about economic development?
- Why does 0.3% growth in the first quarter of GDP not necessarily imply that the UK economy is recovering?
- Why have certain aspects of the UK economy performed better or worse than others?
- What areas should the government invest in, according to the IMF?
- Why would government spending in investment create economic growth? Is this likely to be short term or long term?
 Rising inflation: not normally a cause for celebration, but that’s not the case for Japan. Having been subject to the spectre of deflation for many years, the 22-year high for the CPI at 2.7% is a welcome figure, even it is slightly lower than expected. This surge in prices is partly the result of a growth in domestic demand and a sign, therefore, that output will expand in response to the rise in demand.