 Real GDP depends on two things: output per hour worked and the number of hours worked. On the surface, the UK economy is currently doing relatively well, with growth in 2014 of 2.8%. After several years of poor economic growth following the financial crisis of 2007/8, growth of 2.8% represents a return to the long-run average for the 20 years prior to the crisis.
But growth since 2010 has been entirely due to an increase in hours worked. On the one hand, this is good, as it has meant an increase in employment. In this respect, the UK is doing better than other major economies. But productivity has not grown and on this front, the UK is doing worse than other countries.
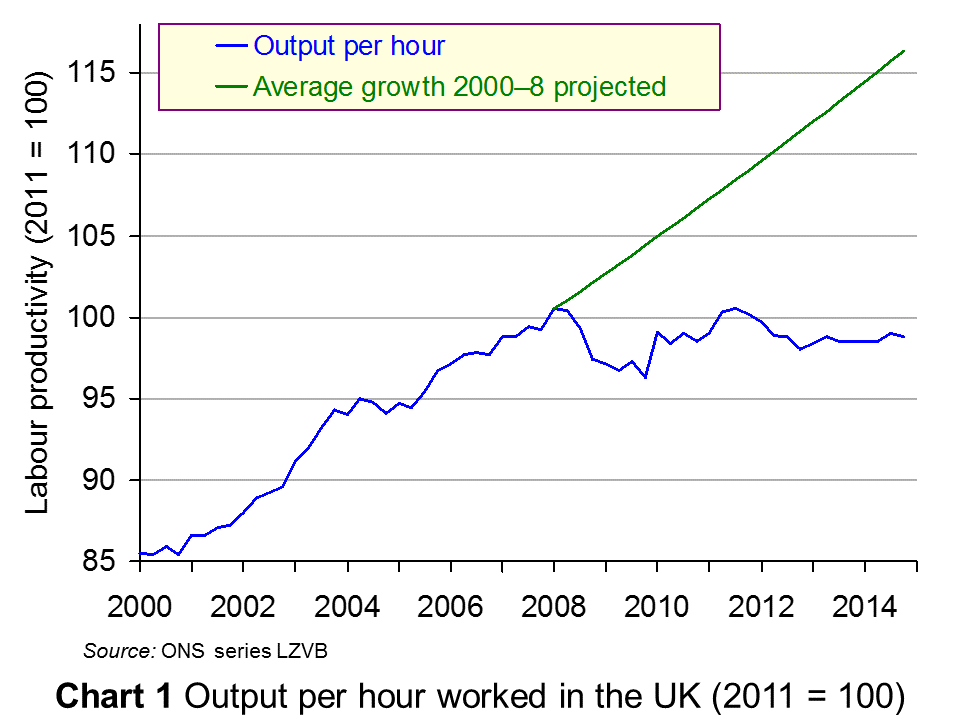 The first chart shows UK output per hour worked (click here for a PowerPoint). It is based on figures released by the ONS on 1 April 2015. Average annual growth in output per hour worked was 2.3% from 2000 to 2008. Since then, productivity growth has stalled and output per hour is now lower than at the peak in 2008.
The green line projects from 2008 what output per hour would have been if its growth had remained at 2.3%. It shows that by the end of 2014 output per hour would have been nearly 18% higher if productivity growth had been maintained.
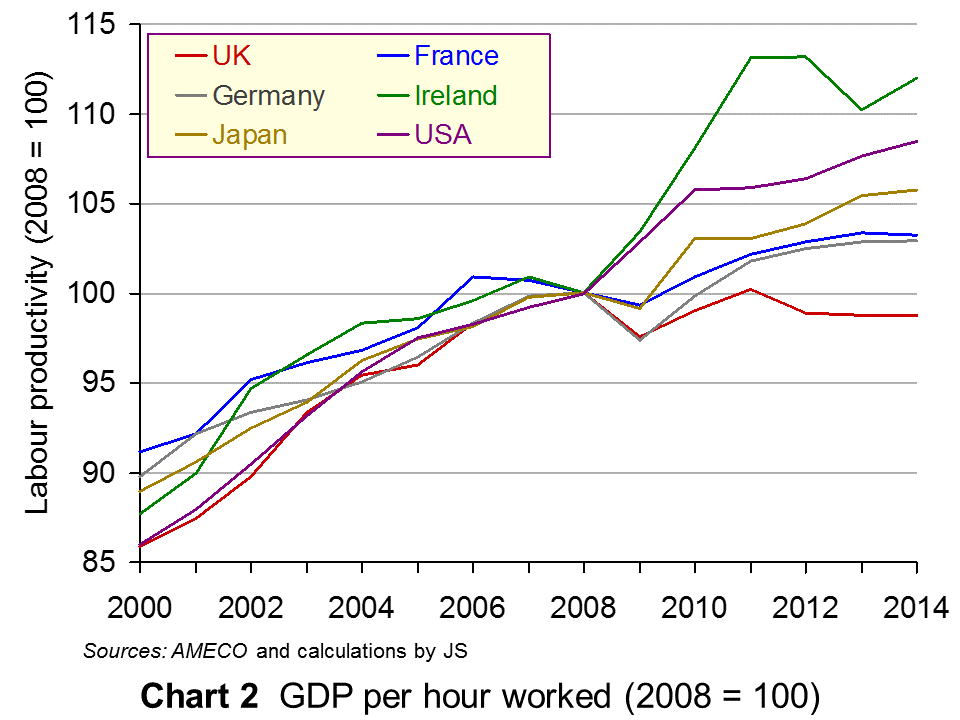 The second chart compares UK productivity growth with other countries (click here for a PowerPoint). Up to 2008, UK productivity was rising slightly faster than in the other five countries illustrated. Since then, it has performed worse than the other five countries, especially since 2011.
Productivity growth increases potential GDP. It also increases actual GDP if the productivity increase is not offset by a fall in hours worked. A rise in hours worked without a rise in productivity, however, even though it results in an increase in actual output, does not increase potential output. If real GDP growth is to be sustained over the long term, there must be an increase in productivity and not just in hours worked.
The articles below examines this poor productivity performance and looks at reasons why it has been so bad.
Articles
UK’s sluggish productivity worsened in late 2014 – ONS Reuters (1/4/15)
UK productivity growth is weakest since second world war, says ONS The Guardian, Larry Elliott (1/4/15)
UK productivity weakness worsening, says ONS Financial Times, Chris Giles (1/4/15)
Is the UK’s sluggish productivity a problem? Financial Times comment (1/4/15)
UK manufacturing hits eight-month high but productivity slump raises fears over sustainability of economic recovery This is Money, Camilla Canocchi (1/4/15)
Weak UK productivity unprecedented, ONS says BBC News (1/4/15)
Weep for falling productivity Robert Peston (1/4/15)
UK’s Falling Productivity Prevented A Massive Rise In Unemployment Forbes, Tim Worstall (2/4/15)
Data
Labour Productivity, Q4 2014 ONS (1/4/15)
AMECO database European Commission, Economic and Financial Affairs
Questions
- How can productivity be measured? What are the advantages and disadvantages of using specific measures?
- Draw a diagram to show the effects on equilibrium national income of (a) a productivity increase, but offset by a fall in the number of hours worked; (b) a productivity increase with hours worked remaining the same; (c) a rise in hours worked with no increase in productivity. Assume that actual output depends on aggregate demand.
- Is poor productivity growth good for employment? Explain.
- Why is productivity in the UK lower now than in 2008?
- What policies can be pursued to increase productivity in the UK?
 Europe’s largest economy is Germany and the prospects and growth figures of this country are crucial to the growth of the Eurozone as a whole. The EU is a key trading partner for the UK and hence the growth data of Germany and in turn of the Eurozone is also essential in creating buoyant economic conditions within our borders. The bad news is that the economic growth forecast for Germany has been cut by the German government.
The German government had previously estimated that the growth rate for this year would be 1.8%, but the estimate has now been revised down to 1.2% and next year’s growth rate has also been revised downwards from 2% to 1.3%. Clearly the expectation is that low growth is set to continue.
Whenever there are changes in macroeconomic variables, a key question is always about the cause of such change, for example is inflation caused by demand-pull or cost-push factors. The German government has been quick to state that the lower growth rates are not due to internal factors, but have been affected by external factors, in particular the state of the global economy. As such, there are no plans to make significant changes to domestic policy, as the domestic economy remains in a strong position. The economy Minister said:
“The German economy finds itself in difficult external waters … Domestic economic forces remain intact, with the robust labour market forming the foundation … As soon as the international environment improves, the competitiveness of German companies will bear fruit and the German economy will return to a path of solid growth … [for this reason there is] no reason to abandon or change our economic or fiscal policy.”
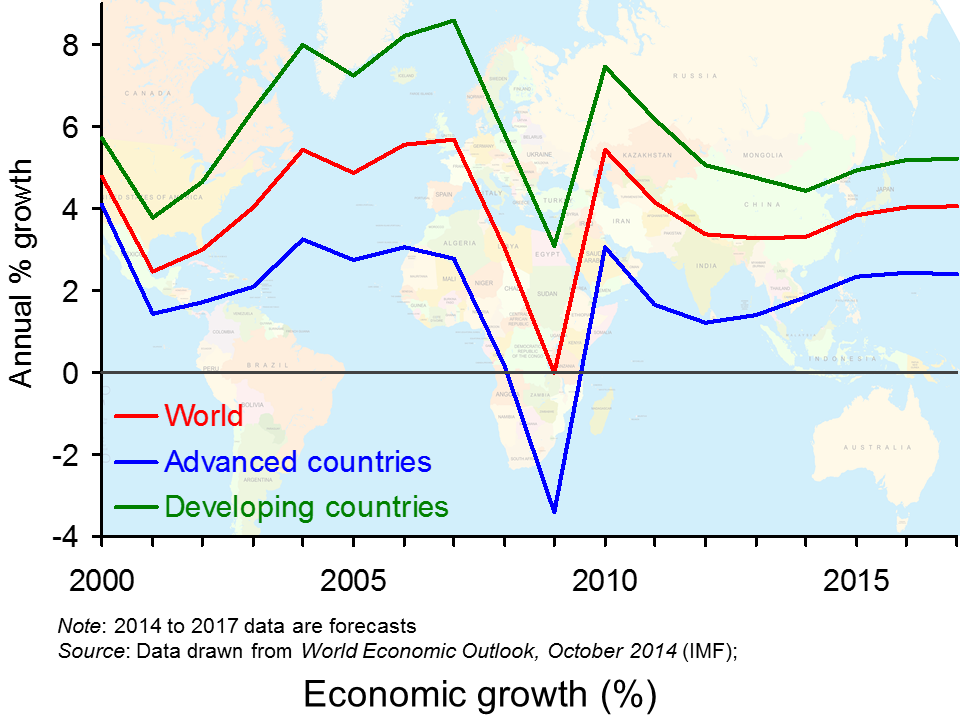 The global picture remains relatively weak and while some economies, including the UK, have seen growth pick up and unemployment fall, there are concerns that the economic recovery is beginning to slow. With an increasingly interdependent world, the slowing down of one economy can have a significant impact on the growth rate of others. If country A begins to slow, demand for imports will fall and this means a fall in the demand for exports of country B. For countries that are dependent on exports, such as Germany and China, a fall in the demand for exports can mean a big decline in aggregate demand and in August, Germany saw a 5.8% drop in exports.
Adding to the gloom is data on inflation, suggesting that some other key economies have seen falls in the rate of inflation, including China. The possibility of a triple-dip recession for the Eurozone has now been suggested and with its largest economy beginning to struggle, this suggestion may become more real. The following articles consider the macroeconomic picture.
Articles
Germany cuts growth forecasts amid recession fears, as Ireland unveils budget The Guardian, Graeme Wearden (14/10/14)
As cracks in its economy widen, is Germany’s miracle about to fade? The Observer, Philip Oltermann (19/10/14)
Why the German economy is in a rut The Economist (21/10/14)
Germany’s flagging economy: Build some bridges and roads, Mrs Merkel The Economist (18/10/14)
Germany cuts 2014 growth forecast from 1.8% to 1.2% BBC News (14/10/14)
IMF to cut growth forecast for Germany – der Spiegel Reuters (5/10/14)
Fears of triple-dip eurozone recession, as Germany cuts growth forecast The Guardian, Phillip Inman (15/10/14)
Germany slashes its economic forecasts Financial Times, Stefan Wagstyl (14/10/14)
 Merkel vows austerity even as growth projection cut Bloomberg, Brian Parkin, Rainer Buergin and Patrick Donahue (14/10/14)
Is Europe’s economic motor finally stalling? BBC News, Damien McGuinness (17/10/14)
Why Germany won’t fight deflation BBC News, Robert Peston (16/10/14)
Data
World Economic Outlook Database IMF (15/10/14)
World Economic Outlook IMF (October 2014)
Questions
- How do we measure economic growth and is it a good indicator of the state of an economy?
- What are the key external factors identified by the Germany government as the reasons behind the decline in economic growth?
- Angela Merkel has said that austerity measures will continue to balance the budget. Is this a sensible strategy given the revised growth figures?
- Why is low inflation in other economies further bad news for those countries that have seen a decline or a slowdown in their growth figures?
- Why is interdependence between nations both a good and a bad thing?
- Using AS and AD analysis, illustrate the reasons behind the decline German growth. Based on your analysis, what might be expected to happen to some of the other key macroeconomic variables in Germany and in other Eurozone economies?
 A key economic objective of governments around the world is economic growth, where economic growth is taken to mean growth in Gross Domestic Product (GDP). This can be refined as growth in GDP per head or growth in Net National Income (NNY or NNI) – this takes account of depreciation and net flows of income to and from abroad. But is GDP (or NNY) an appropriate measure? There continues to be much debate about this and there is a lot of support for adopting an alternative measure – the Genuine Progress Indicator (GPI) as a target for economic policy.
GDP measures the market value of production and is the value added at each stage of production. If the value of a nation’s production is what you want to measure or target, then GDP is quite a good indicator. Its main drawbacks are that it uses market prices, which may be distorted, and that much of production in the informal sector is not included.

But if GDP growth is taken to be a proxy for development or growth in wellbeing of the residents of a country, then it has serious shortcomings. This is not to say that GDP gives no indication of progress. Generally, countries with higher GDP per head have a better standard of living, but it is not necessarily the case that, if Country A has higher production in the formal sector than Country B, its residents will be happier, more fulfilled and have fewer economic or other problems.
GDP, by focusing on production, ignores many environmental and social costs of that production. Valuable but not tradable resources, such as clean air, rivers and oceans, may be sacrificed for the sake of extra production and this is recorded as a gain in GDP.
Similarly, unless GDP is specifically weighted by income groups, which virtually never happens, it does not take into account income distribution. Much of the growth in production in both rich and poor countries in recent decades has gone to the richest people. Take the case of the USA. In 1944 the share of income going to the top 1% share was 11.3%, while the bottom 90% were receiving 67.5%.  Such levels remained roughly constant for the next three decades. But then things began to change.
Starting in the mid- to late 1970s, the uppermost tier’s income share began rising dramatically, while that of the bottom 90% started to fall. The top 1% took heavy hits from the dot-com crash and the Great Recession but recovered fairly quickly: [preliminary estimates for 2012 by Emmanuel Saez] have that group receiving nearly 22.5% of all pre-tax income, while the bottom 90%’s share is below 50% for the first time ever (49.6%, to be precise).
So what does GPI measure and why may it be a better target for policy-makers than GDP or NNY? The answer is that it includes a number of important items that affect the well-being of a country, such as resource depletion, social activity and income distribution, that are not measured in GDP.  So what would cause GPI to rise? According to The Guardian article below, examples would include:
Getting more energy from renewables; increased energy efficiency; reducing the income gap; putting more reliable, durable products on the market (have you heard of planned obsolescence?); volunteering more for your community; preserving wetlands, forests, and farmland; shorter commutes and transport routes. In fact, there are 26 ways the GPI can go up, all measured in dollars that boil down to a single number.
GPI is being increasingly adopted as a measure of progress. In the USA, it is officially used in Vermont and Maryland and is being considered in other states, such as Hawaii, Washington and Oregon.
And there are other alternatives. For example, since 1990, the United Nations Development Programme (UNDP) has published an annual Human Development Index (HDI) As Box 27.1 in Economics, 8th edition states:
HDI is the average of three indices based on three sets of variables: (i) life expectancy at birth, (ii) education (a weighted average of (a) the mean years that a 25-year-old person or older has spent in school and (b) the number of years of schooling that a 5-year-old child is expected to have over their lifetime) and (iii) real GNY per capita, measured in US dollars at purchasing-power parity exchange rates.
The following articles look at the suitability of GDP and GPI and whether, by targeting growth in GDP, governments are guilty of downplaying the importance of other economic and social objectives.
Beyond GDP: US states have adopted genuine progress indicators The Guardian, Marta Ceroni (23/9/14)
Forget the GDP. Some States Have Found a Better Way to Measure Our Progress. New Republic, Lew Daly and Sean McElwee (3/2/14)
Gross domestic problem Aljazeera, Sean McElwee (6/6/14)
Creating the Circular Economy, Part II Environmental Leader, David Dornfeld (17/9/14)
Development: Time to leave GDP behind Nature, Robert Costanza, Ida Kubiszewski, Enrico Giovannini, Hunter Lovins, Jacqueline McGlade, Kate E. Pickett, Kristín Vala Ragnarsdóttir, Debra Roberts, Roberto De Vogli and Richard Wilkinson (15/1/14)
The Problems With Using GPI Rather Than GDP Forbes, Tim Worstall (5/6/14)
Questions
- What does GDP measure?
- Does GDP of a country equate to the turnover of a firm?
- If growth in NNY is superior to growth in GDP as a measure of economic growth, why are GDP figures more generally used than NNY figures when assessing a country’s economic performance?
- How suitable is using GDP as a measure of a nation’s production?
- What does GPI measure?
- Is GPI superior to GDP as a measure of a nation’s level of development? Explain why or why not.
- Give some examples of where a growth in GDP might correspond to a decline in economic well-being.
- For what reasons could GPI measures be described as subjective?
- Would it be a good idea for a country to target growth in GPI/GDP? Explain your answer.
- In addition to real GNY per capita, the Human Development Index includes measures of education and life expectancy. For what other social objectives might education and life expectancy be useful proxies?
 Now here’s a gloomy article from Robert Peston. He’s been looking at investors’ views about the coming years and sees a general pessimism about the prospects for long-term economic growth. And that pessimism is becoming deeper.
It is true that both the UK and the USA have recorded reasonable growth rates in recent months and do seem, at least on the surface, to be recovering from recession. But, according to investor behaviour, they:
seem to be saying, in how they place their money, that the UK’s and USA’s current reasonably rapid growth will turn out to be a short-lived period of catch-up, following the deep recession of 2008-9.
So what is it about investor behaviour that implies a deep pessimism and are investors right to be pessimistic? The article explores these issues. It does also look at an alternative explanation that investors may merely be being cautious until a clearer picture emerges about long-term growth prospects – which may turn out to be better that many currently now predict.
The article finishes by looking at a possible solution to the problem (if you regard low or zero growth as a problem). That would be for the government to ‘throw money at investment in infrastructure – to generate both short-term growth and enhance long-term productive potential.’
Note that Elizabeth also looks at this article in her blog The end of growth in the west?.
The end of growth in the West? BBC News, Robert Peston (26/9/14)
Questions
- What is meant by the ’25-year yield curve for government bonds’? Why does this yield curve imply a deep level of business pessimism about the long-term prospects for UK economic growth?
- What are the determinants of long-term economic growth?
- Looking at these determinants, which ones suggest that long-term economic growth may be low?
- Are there any determinants which might suggest that economic growth will be maintained over the long term at historical levels of around 2.6%?
- Do demand-side policies affect potential GDP and, if so, how?
- What policies could government pursue to increase the rate of growth in potential GDP?
- What current ‘dramas’ affecting the world economy could have long-term implications for economic growth? How does uncertainty about the long-term implications for the global economy of such dramas itself affect economic growth?
- Is long-term growth in real GDP an appropriate indicator of (a) economic development and (b) long-term growth in general well-being?
 The most commonly used measure of economic performance is GDP and while there is agreement that it is an important and useful measure, there is also agreement that there are some big problems with it. Does it measure welfare or quality of life? What is and isn’t included? Do some things add to GDP which actually make us worse off?
One criticism often levelled at GDP is that there are many aspects that go unmeasured – often known as the underground economy. Some areas are typical everyday things – DIY, looking after your own children rather than paying someone to do it, or even giving yourself a haircut. But, there are other activities, often illegal, which go unrecorded, such as the selling and distribution of drugs and prostitution. In countries like the Netherlands, their GDP figures get a boost, as some drugs and prostitution are legal. In other countries, such data is not recorded and as such, the contribution of these markets is under-estimated or even completely omitted.
However, this aspect of the calculation of GDP statistics is changing across Europe, which will allow much easier and more meaningful comparisons of relative GDP across countries. This extra production will therefore offer a positive contribution towards our GDP and perhaps suggest to the untrained eye that the British economy is growing, which can only be good news. But, for the trained economist, we are looking at extra data being added, which will boost total output and the question will be does it really indicate that the economy is better off? The following articles consider this change to GDP.
Small data: The way drugs and prostitution boost the economy BBC News (4/4/14)
Small data: Calculating the sex and drugs economy BBC News (2/6/14)
UK economic output to be revised up after ONS updates BBC News, Anthony Reuben (10/6/14)
UK economic output will get near 5 percent boost from data changes Reuters (10/6/14)
Accounting for drugs and prostitution to help push UK economy up by £65bn The Guardian, Katie Allen (10/6/14)
Questions
- What does GDP measure? Is it good at measuring it?
- Explain the pros and cons of using GDP to measure the welfare of an economy.
- Why are there problems using GDP to compare output between countries?
- Is it a good idea to include markets such as sex and drugs in calculating a nation’s output?
- What other measures of welfare do we have?
 Real GDP depends on two things: output per hour worked and the number of hours worked. On the surface, the UK economy is currently doing relatively well, with growth in 2014 of 2.8%. After several years of poor economic growth following the financial crisis of 2007/8, growth of 2.8% represents a return to the long-run average for the 20 years prior to the crisis.