 Young people are increasingly finding it impossible to buy their own home. The reasons are easy to find: income rises of young people have failed to match rises in house prices, and access to loans has become more restrictive since the financial crisis. In 2002, 58.6% of 25-34 year-olds owned their own home; today, the figure is just 36.7%.
Conventional wisdom is that the source of the problem is on the supply side: a lack of house building. But according to the Redfern Review, led by the chief executive of Taylor Wimpey, Pete Redfern, the source of the problem lies mainly on the demand side. Overall demand for housing has been rapidly rising, stoked by low interest rates and the Help to Buy scheme, which is available to existing home owners as well as first-time buyers. However, purchases by first-time buyers have fallen as their incomes have declined relative to those of older people.
Of course, increasing supply, especially of cheaper starter homes, would help young people, but, according to the Redfern Review, such schemes take a long time to make much of a difference (although building modular homes could be much quicker). In the meantime, help could be provided on the demand side by making the Help to Buy scheme available only to first-time buyers and by increasing the help to them provided under the scheme, and also by encouraging lenders to make access to mortgages easier.
But a problem for most young people is high levels of debt, including student loans. Such debt and a lack of savings makes it difficult to raise a deposit, let alone afford mortgage repayments. And on the rental side, accommodation is becoming less and less affordable as rents rise faster than incomes, further exacerbating the difficulty of clawing down debt and saving for a deposit.
A long-term solution must involve increased supply – as the Redfern Review recognises. But in the short-term, providing more help to first-time buyers and those paying high rents could make a significant difference.
Webcast
 Tackling UK housing crisis ‘will take generations’ ITV News, Joel Hills (16/11/16)
Articles
Review of home ownership in UK shows severe decline in young buyers PropertyWire (16/11/16)
Housing crisis: Lack of new building not to blame for soaring house prices finds Labour-commissioned report Independent, Ben Chu and Ashley Cowburn (16/11/16)
Redfern Review: Focus on First Time Buyers and Launch Housing Commission Money Expert, Danny Lord (16/11/16)
First-time buyers need more help, review finds BBC News (16/11/16)
Redfern Review echoes Homes for Scotland’s call for joined-up approach to housing Scottish Housing News, Nicola Barclay (17/11/16)
Redfern review into housing: worth building on? The Guardian, Nils Pratley (15/11/16)
UK housing review downplays developers’ role in crisis, critics say The Guardian, Graham Ruddick (16/11/16)
Report
The Redfern Review into the decline of homeownership (16/11/16)
Data
Economic Data freely available online: UK house prices The Economics Network
UK House Price to income ratio and affordability Economics Help blog (21/9/15)
House Price Index Nationwide
UK House Price Index: reports ONS/Land Registry
House Price Index: Statistical Bulletin ONS (Sept. 2016)
Questions
- Do a data search to find out what has happened since 1990 to (a) average UK house prices; (b) average incomes; (c) the distribution of income since 1990; (d) first-time buyer affordability of houses.
- Use a supply and demand diagram to illustrate current average house prices compared with house prices in 2000.
- How does the price elasticity of supply of houses affect the impact of a rise in demand on house prices? Illustrate your answer with a diagram.
- What determines the price elasticity of supply of houses?
- What particular problems do young people face in being able to afford to buy a house or flat?
- How would making it easier for young people to be able to raise finance to purchase their first home affect the price of starter homes?
- What policies could be adopted by the government to make rents more affordable? Discuss the advantages and disadvantages of such policies.
 Many countries have experienced soaring house prices in recent years. To find out why, you need to look at demand and supply.
Low mortgage interest rates and more relaxed lending rules in the last couple of years have stimulated demand. In some countries, such as the UK, demand has been further boosted by governments providing increased help to buyers. In others, various tax breaks are given to house purchasers.
Typically the rise in demand has not been matched by an equivalent rise in supply. Social house building has slowed in many countries and building for private purchase has often be hampered by difficulties in obtaining appropriate land or getting planning permission.
The articles linked below look at the situation in Australia. Here too house prices have been soaring. Over the past 30 years they have grown by 7.25% per year – way above the growth in incomes. As the second article below states:
So expensive are homes becoming that the share of median household income devoted to mortgage payments for Australians aged 35 to 44 has more than doubled in 30 years. Incredibly, it’s happened at a time when mortgage rates have slid to their lowest on record.
But why? Again, to understand this it is necessary to look at demand and supply.
 Strong population growth combined with easy availability of mortgage loans, low interest rates and tax breaks for both owner occupiers and property investors have stoked demand, while new building has lagged behind. As far as investors are concerned, any shortfall of rental income over mortgage payments (known as negative gearing) can be offset against tax – and then there is still the capital gain to be made from any increase in the property’s price.
But in some Australian towns and cities, price rises have started to slow down or even fall. This may be due to a fall in demand. For example, in Perth, the ending of the commodity boom has led to a fall in demand for labour in the mining areas; mine workers often live in Perth and fly up to the mining areas for shifts of a week or more.  The fall in demand for labour has led to a fall in demand for housing.
House price changes are amplified by speculation. People rush to buy houses when they think house prices will rise, further pushing up prices. Landlords do the same. This speculation fuels the price rises. Speculation also amplifies price falls, with people with houses to sell keen to sell them quickly before prices fall further. Potential purchasers, including property investors, hold back, waiting for prices to fall.
Articles
House prices are surging because of low supply – it’s Economics 101 The Guardian, Stephen Koukoulas (27/10/16)
Who’s to blame for rising house prices? We are, actually. Sydney Morning Herald, Peter Martin (27/10/16)
The Price of Australia’s Real Estate Boom The New York Times, A. Odysseus Patrick (17/10/16)
Solutions beyond supply to the housing affordability problem The Conversation, Nicole Gurran (24/10/16)
Data
Residential Property Price Indexes: Eight Capital Cities Australian Bureau of Statistics (20/9/16)
Questions
- Identify the specific demand factors that have driven house price rises in Australia.
- How are the price elasticities of demand and supply relevant to explaining house price rises? Use a diagram to illustrate your analysis.
- What determines the rate of increase in house prices?
- Explain what is meant by ‘negative gearing’. How is the tax treatment of negative gearing relevant to the property market?
- What are the arguments for and against giving tax breaks for house purchase?
- Why are rising prices seen as politically desirable by politicians?
- What practical steps could a government (central or local) take to increase the supply of housing? Would such steps always be desirable?
- Does speculation always amplify house price changes? Explain.
- How are house prices related to inequality?
 Your Americano, Latte or Cappuccino may soon be more expensive. This is because coffee bean prices are rising. A combination of continuing growth in demand and poor coffee harvests in various parts of the world have led to a rise in both Arabica and Robusta prices, with the International Coffee Organization’s Composite Indicator price (in US dollars) having risen by over 30% since mid-January this year (see chart below: click here for a PowerPoint)
Supply has been affected by droughts in Brazil and Vietnam, two of the world’s biggest coffee producers, and by pests (the Coffee Berry Borer) in the Kilimanjaro region of Tanzania and in other East African countries. Global exports of coffee in July 2016 were 22% down on the same month in 2015.
The growing shortage and rising current (spot) prices is reflected in future prices. 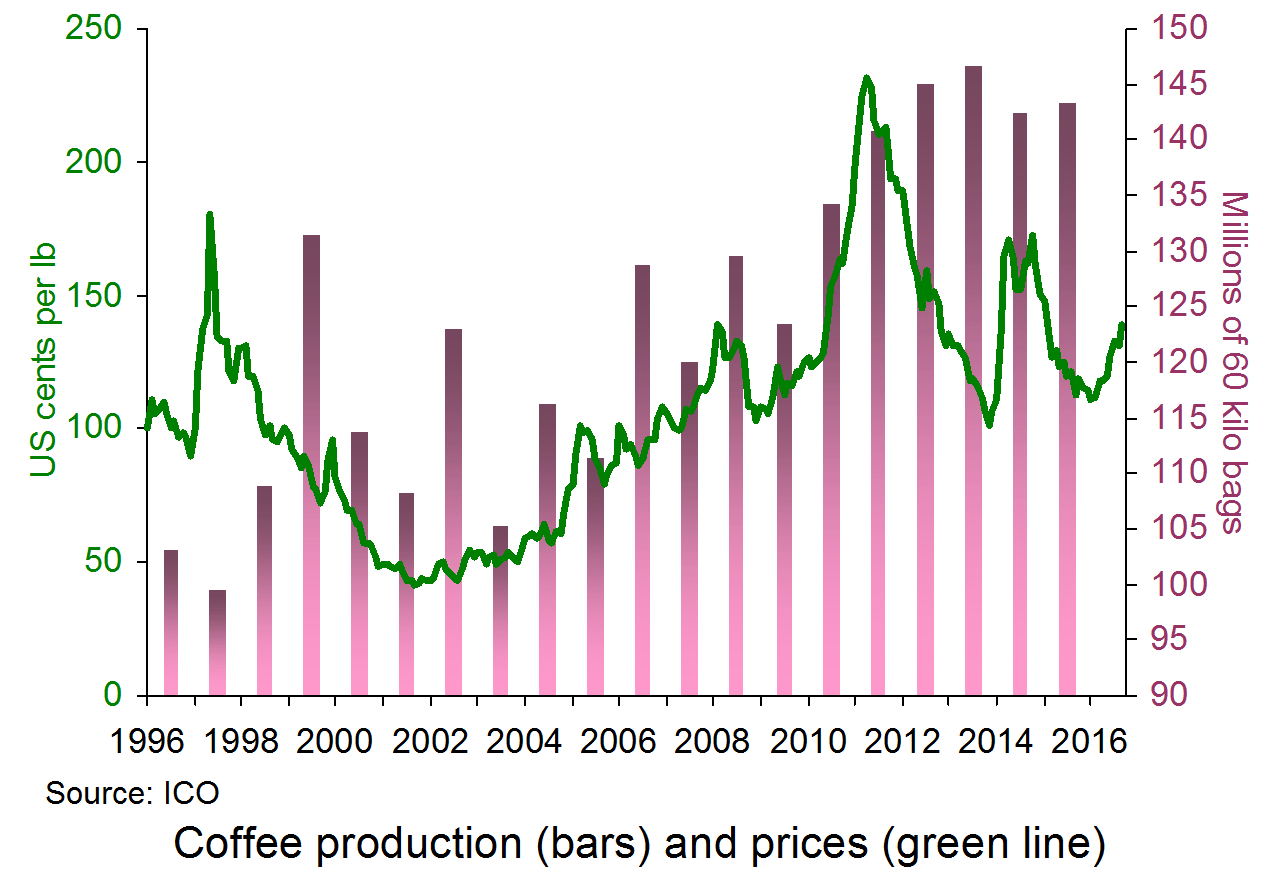 These are prices determined in the market now for trading at a specified future date (e.g. in three months’ time). Future prices depend on predictions of the balance of demand and supply in the future. According to the MarketWatch article below, “Analysts at Société Générale in a note predicted that prices could climb about 30% further by the end of next year”. The current (mid-September) spot price of robusta coffee beans is around $0.96 per lb. The December 2016 future price is around $1.48.
 So what effect will this have on the prices in Starbucks, Costa or Caffè Nero? And what effect will it have on ground or instant coffee in supermarkets? To quote the MarketWatch article again:
A research report from the US Department of Agriculture found that, on average, a 10% increase in green-coffee-bean prices per pound would yield a 2% increase in both manufacturer prices and at the register in places like Starbucks Corp.
This is because the cost of coffee beans is just one element in the costs of coffee roasters and coffee shops. Also these companies use futures markets to smooth out the prices they pay. They hold stockpiles of coffee, which they build up when prices are low and draw on when prices are high. This helps to reduce fluctuations in retail prices.
So don’t worry too much about the price of your morning coffee – at least, not yet.
Articles
Why a surge in coffee-bean prices may not hit the Starbucks set—yet MarketWatch, Rachel Koning Beals (9/9/16)
Wired coffee prices may not slip far News Markets, David Cottle (9/9/16)
Late-harvest woes prompt Brazil coffee harvest downgrade Agrimoney (7/9/16)
Look Out, Latte Lovers: Brazil Drought Hurts Espresso Beans Bloomberg, Fabiana Batista and Marvin G. Perez (13/9/16)
Why Your Morning Coffee Is About to Become Even More Expensive Fortune (28/7/16)
Climate change brews a storm for East Africa coffee farmers Business Daily (East Africa), Paul Redfern (4/9/16)
Coffee Market Report ICO (August 2016)
Data
Commodity Prices Index Mundi
Historical Data on the Global Coffee Trade ICO
ICO’s Coffee Trade Statistics Infographic for July 2016 ICO blog (31/8/16)
Questions
- What determines coffee futures prices?
- How are the price fluctuations of coffee in coffee shops related to the price elasticities of demand and supply? What determines these elasticities?
- Why does a strengthening (an appreciation) of the currency of a coffee exporter affect (a) the price of coffee to producers in the country; (b) international coffee prices in dollars?
- Are poor coffee harvests on balance good or bad for coffee producers? How does this depend on the market price elasticity of demand? Does the answer vary from producer to producer?
- How does speculation affect coffee prices (both spot and future)? Is such speculation of benefit to (a) the coffee consumer; (b) the coffee grower?
 Back in October, we looked at the growing pressure in the UK for a sugar tax. The issue of childhood obesity was considered by the Parliamentary Health Select Committee and a sugar tax, either on sugar generally, or specifically on soft drinks, was one of the proposals being considered to tackle the problem. The committee studied a report by Public Health England, which stated that:
Research studies and impact data from countries that have already taken action suggest that price increases, such as by taxation, can influence purchasing of sugar sweetened drinks and other high sugar products at least in the short-term with the effect being larger at higher levels of taxation.
In his Budget on 16 March, the Chancellor announced that a tax would be imposed on manufacturers of soft drinks from April 2018. This will be at a rate of 18p per litre on drinks containing between 5g and 8g of sugar per 100ml, such as Dr Pepper, Fanta and Sprite, and 24p per litre for drinks with more than 8g per 100ml, such as Coca-Cola, Pepsi and Red Bull.
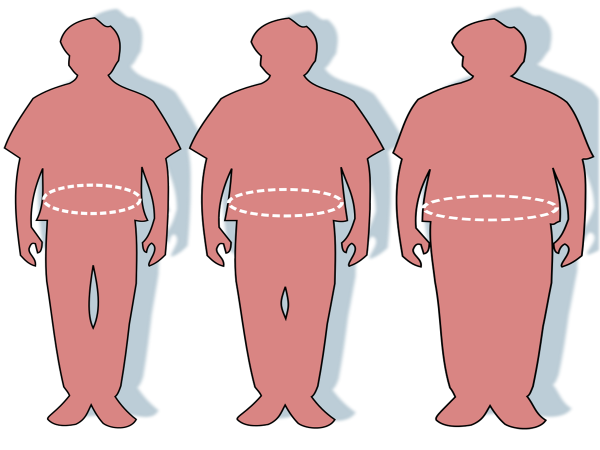 Whilst the tax has been welcomed by health campaigners, there are various questions about (a) how effective it is likely to be in reducing childhood obesity; (b) whether it will be enough or whether other measures will be needed; and (c) whether it is likely to raise the £520m in 2018/19, falling to £455m by 2020/21, as predicted by the Treasury: money the government will use for promoting school sport and breakfast clubs.
These questions are all linked. If demand for such drinks is relatively inelastic, the drinks manufacturers will find it easier to pass the tax on to consumers and the government will raise more revenue. However, it will be less effective in cutting sugar consumption and hence in tackling obesity. In other words, there is a trade off between raising revenue and cutting consumption.
 This incidence of tax is not easy to predict. Part of the reason is that much of the market is a bilateral oligopoly, with giant drinks manufacturers selling to giant supermarket chains. In such circumstances, the degree to which the tax can be passed on depends on the bargaining strength and skill of both sides. Will the supermarkets be able to put pressure on the manufacturers to absorb the tax themselves and not pass it on in the wholesale price? Or will the demand be such, especially for major brands such as Coca-Cola, that the supermarkets will be willing to accept a higher price from the manufacturers and then pass it on to the consumer?
Then there is the question of the response of the manufacturers. How easy will it be for them to reformulate their drinks to reduce sugar content and yet still retain sales? For example, can they produce a product which tastes like a high sugar drink,  but really contains a mix between sugar and artificial sweeteners – effectively a hybrid between a ‘normal’ and a low-cal version? How likely are they to reduce the size of cans, say from 330ml to 300ml, to avoid raising prices?
The success of the tax on soft drinks in cutting sugar consumption depends on whether it is backed up by other policies. The most obvious of these would be to impose a tax on sugar in other products, including cakes, biscuits, low-fat yoghurts, breakfast cereals and desserts, and also many savoury products, such as tinned soups, ready meals and sauces. But there are other policies too. The Public Health England report recommended a national programme to educate people on sugar in foods; reducing price promotions of sugary food and drink; removing confectionery or other sugary foods from end of aisles and till points in supermarkets; setting broader and deeper controls on advertising of high-sugar foods and drinks to children; and reducing the sugar content of the foods we buy through reformulation and portion size reduction.
Articles
- Sugar tax: How it will work?
BBC News, Nick Triggle (16/3/16)
- Will a sugar tax actually work?
The Guardian, Alberto Nardelli and George Arnett (16/3/16)
- Coca-Cola and other soft drinks firms hit back at sugar tax plan
The Guardian, Sarah Butler (17/3/16)
- Sugar tax could increase calories people consume, economic experts warn
The Telegraph, Kate McCann, and Steven Swinford (17/3/16)
- Nudge, nudge! How the sugar tax will help British diets
Financial Times, Anita Charlesworth (18/3/16)
- Is the sugar tax an example of the nanny state going too far?
Financial Times (19/3/16)
- Government’s £520m sugar tax target ‘highly dubious’, analysts warn
The Telegraph, Ben Martin (17/3/16)
- Sorry Jamie Oliver, I’d be surprised if sugar tax helped cut obesity
The Conversation, Isabelle Szmigin (17/3/16)
- Sugar sweetened beverage taxes
What Works for Health (17/12/15)
Questions
- What determines the price elasticity of demand for sugary drinks in general (as opposed to one particular brand)?
- How are drinks manufacturers likely to respond to the sugar tax?
- How are price elasticity of demand and supply relevant in determining the incidence of the sugar tax between manufacturers and consumers? How is the degree of competition in the market relevant here?
- What is meant by a socially optimal allocation of resources?
- If the current consumption of sugary drinks is not socially optimal, what categories of market failure are responsible for this?
- Will a sugar tax fully tackle these market failures? Explain.
- Is a sugar tax progressive, regressive or proportional? Explain.
- Assess the argument that the tax on sugar in soft drinks may actually increase the amount that people consume.
- The sugar tax can be described as a ‘hypothecated tax’. What does this mean and is it a good idea?
- Compare the advantages and disadvantages of a tax on sugar in soft drinks with (a) banning soft drinks with more than a certain amount of sugar per 100ml; (b) a tax on sugar; (c) a tax on sugar in all foods and drinks.
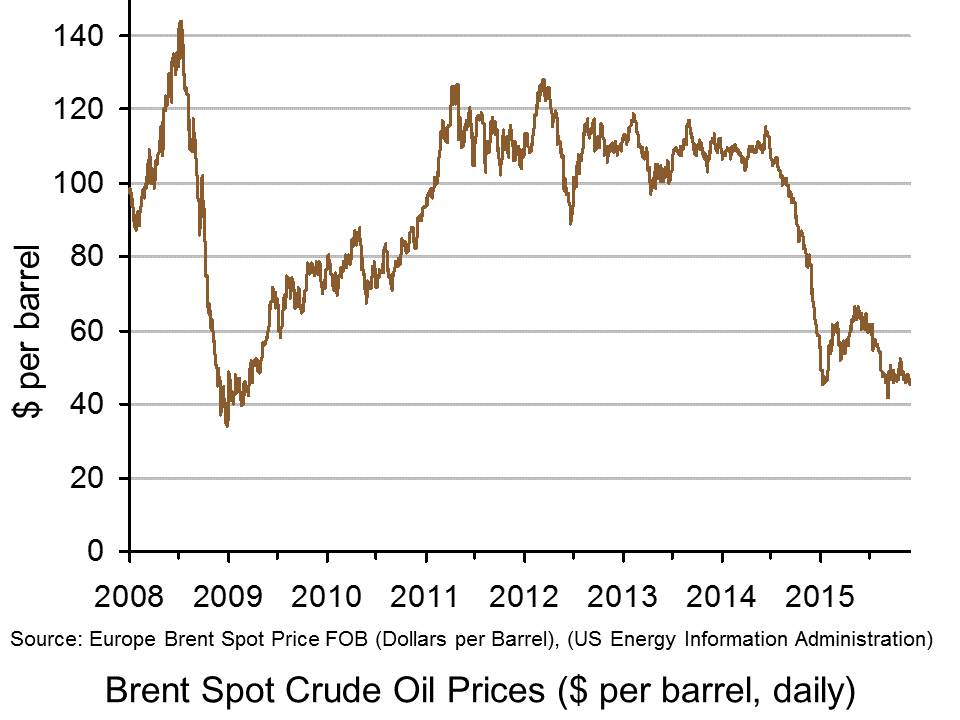
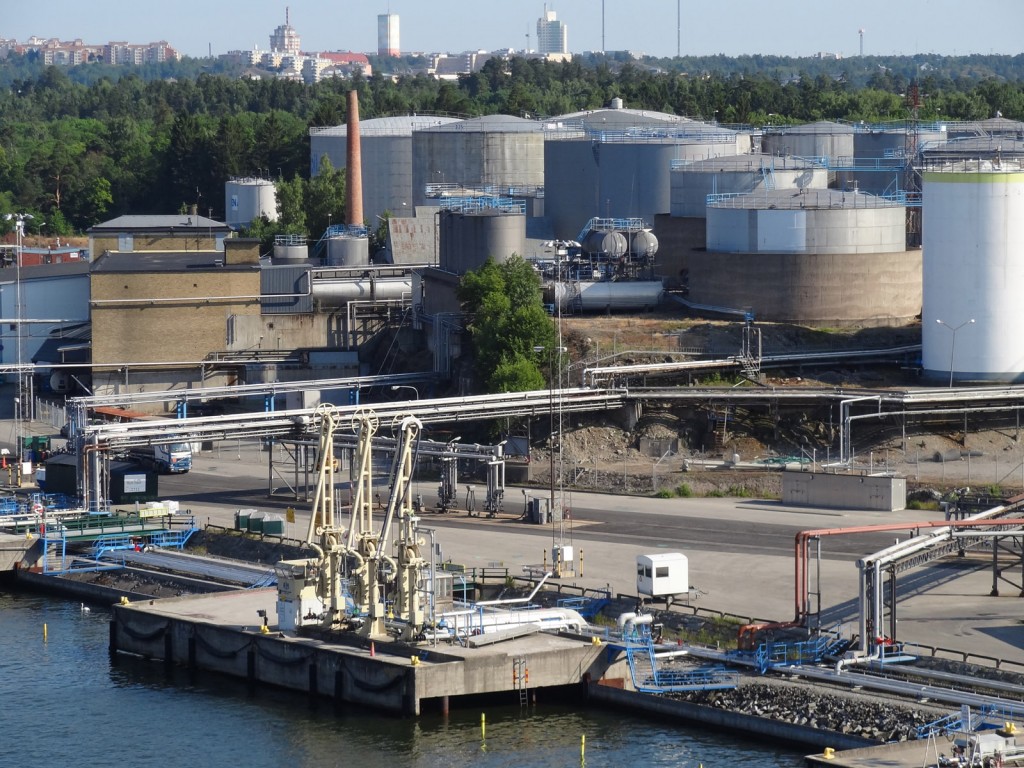 The demand for oil is growing and yet the price of oil, at around $46 per barrel over the past few weeks, remains at less than half that of the period from 2011 to mid 2014. The reason is that supply has been much larger than demand. The result has been a large production surplus and a growth in oil stocks. Supply did fall somewhat in October, which reduced the surplus in 2015 Q3 below than of the record level in Q2 – but the surplus was still the second highest on record.
What is more, the modest growth in demand is forecast to slow in 2016. Supply, however, is expected to decrease through the first three quarters of 2016, before rising again at the end of 2016. The result will be a modest rise in price into 2016, to around $56 per barrel, compared with an average of just over $54 per barrel so far for 2015 (click here for a PowerPoint of the chart below).
 But why does supply remain so high, given such low prices? As we saw in the post The oil industry and low oil prices, it is partly the result of increases in supply from large-scale investment in new sources of oil over the past few years, such as the fracking of shale deposits, and partly the increased output by OPEC designed to keep prices low and make new investment in shale oil unprofitable.
So why then doesn’t supply drop off rapidly? As we saw in the post, A crude indicator of the economy (Part 2), even though shale oil producers in the USA need a price of around $70 or more to make investment in new sources profitable, the marginal cost of extracting oil from existing sources is only around $10 to £20 per barrel.  This means that shale oil production will continue until the end of the life of the wells. Given that wells typically have a life of at least three years, it could take some time for the low prices to have a significant effect on supply. According to the US Energy Information Administration’s forecasts, US crude oil production will drop next year by only just over 5%, from an average of 9.3 million barrels per day in 2015 to 8.8 million barrels per day in 2016.
In the meantime, we can expect low oil prices to continue for some time. Whilst this is bad news for oil exporters, it is good news for oil importing countries, as the lower costs will help aid recovery.
Webcasts
IEA says oil glut could worsen through 2016 Euronews (13/11/15)
IEA Says Record 3 Billion-Barrel Oil Stocks May Deepen Rout BloombergBusiness, Grant Smith (13/11/15)
Articles
IEA Offers No Hope For An Oil-Price Recovery Forbes, Art Berman (13/11/15)
Oil glut to swamp demand until 2020 Financial Times, Anjli Raval (10/11/15)
Record oil glut stands at 3bn barrels BBC News (13/11/15)
Global oil glut highest in a decade as inventories soar The Telegraph, Mehreen Khan (12/11/15)
The Oil Glut Was Created In Q1 2015; Q3 OECD Inventory Movements Are Actually Quite Normal Seeking Alpha (13/11/15)
Record oil glut stands at 3 billion barrels Arab News (14/11/15)
OPEC Update 2015: No End To Oil Glut, Low Prices, As Members Prepare For Tense Meeting International Business Times, Jess McHugh (12/11/15)
Surviving The Oil Glut Investing.com, Phil Flynn (11/11/15)
Reports and data
Oil Market Report International Energy Agency (IEA) (13/11/15)
Short-term Energy Outlook US Energy Information Administration (EIA) (10/11/15)
Brent Crude Prices US Energy Information Administration (EIA)
Questions
- Using demand and supply diagrams, demonstrate (a) what has been happening to oil prices in 2015 and (b) what is likely to happen to them in 2016.
- How are the price elasticities of demand and supply relevant in explaining the magnitude of oil price movements?
- What are oil prices likely to be in five years’ time?
- Using aggregate demand and supply analysis, demonstrate the effect of lower oil prices on a national economy.
- Why might the downward effect on inflation from lower oil prices act as a stimulus to the economy? Is this consistent with deflation being seen as requiring a stimulus from central banks, such as lower interest rates or quantitative easing?
- Do you agree with the statement that “Saudi Arabia is acting directly against the interests of half the cartel and is running OPEC over a cliff”?
- If the oil price is around $70 per barrel in a couple of years’ time, would it be worth oil companies investing in shale oil wells at that point? Explain why or why not.
- Distinguish between short-run and long-run shut down points. Why is the short-run shut down price likely to be lower than the long-run one?
 Young people are increasingly finding it impossible to buy their own home. The reasons are easy to find: income rises of young people have failed to match rises in house prices, and access to loans has become more restrictive since the financial crisis. In 2002, 58.6% of 25-34 year-olds owned their own home; today, the figure is just 36.7%.
 by increasing the help to them provided under the scheme, and also by encouraging lenders to make access to mortgages easier.