 Compared with pre-financial crisis levels, the British pound is significantly weaker when measured against a basket of foreign currencies. In this blog we provide a further update of Appreciating a depreciating pound which was published back in early December 2012. The significance of the depreciation should be seen in the context of the UK as an open, island-economy where the ratio of exports to GDP in 2012 was close to 32%.
The competitiveness of our exports is, in part, affected by the exchange rate. Floating exchange rates are notoriously volatile. For example, some of the articles below show how sensitive the British pound can be latest news on the economy. However, since the autumn of 2007 we have observed a significant depreciation of the UK exchange rate. A depreciation helps to make our exports more competitive abroad and can potentially boost aggregate demand.
Rather than simply focus on bilateral exchange rates and so at the British pound separately against other foreign currencies, we can estimate an average exchange rate against a whole bundle of currencies. The average rate is calculated by weighting the individual exchange rates by the amount of trade between Britain and the other countries. This trade-weighted exchange rate is known as the effective exchange rate.
In analysing the competitiveness of the exchange rate, we can go one step further and adjust for the average (domestic currency) price of our exports relative to the average (foreign currency) price of those goods we import. Therefore, as well as the nominal (actual) effective exchange rate we can calculate a real effective exchange rate. If the average price of our exports rises relative to the average price of imports, the real effective exchange rate rises relative to the nominal rate. It means that we are able to obtain a larger volume of imports from selling a given volume of exports.
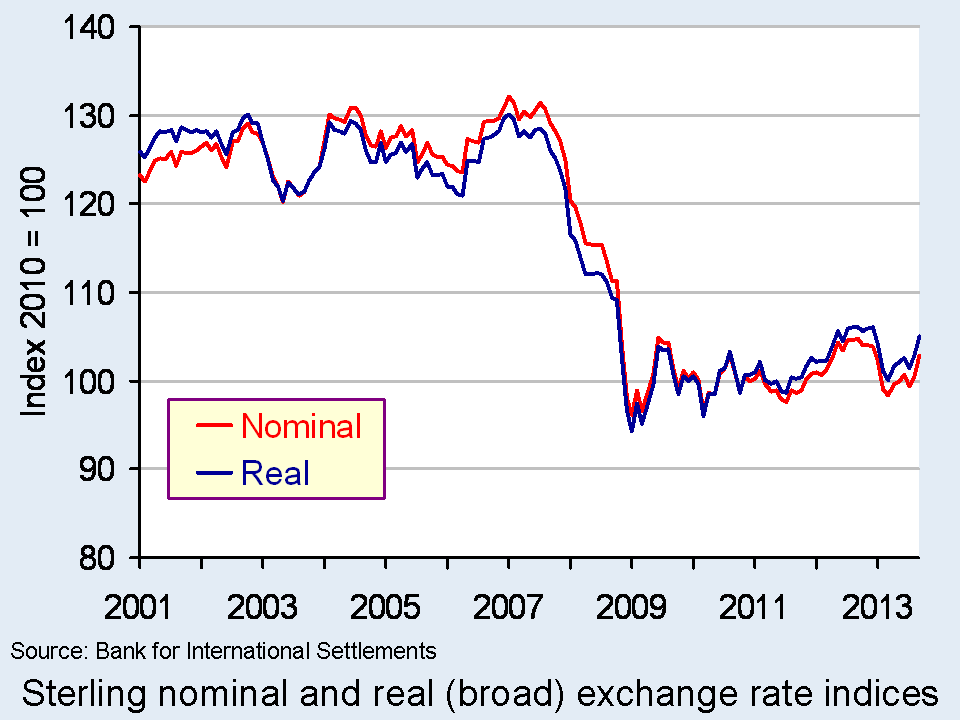 The chart shows the nominal (actual) and real effective exchange rate for the British pound since 2001. The chart shows clearly how from the autumn of 2007 the effective exchange rate fell sharply both in nominal and real terms.
Over the period from July 2007 to January 2009 the nominal effective exchange rate fell by 26.8 per cent while the real effective exchange rate fell by 26.6 per cent. In other words, the British pound depreciated more than one-quarter over an 18-month period. In comparison, the American dollar rose by 5.3 per cent in nominal terms and by 1.9 per cent in real terms. (Click here to download a PowerPoint of the chart.)
If we move the clock forward, we observe an appreciation of the British pound between July 2011 and September 2012. Over this period, the British pound appreciated by 7.0 per cent in nominal terms and by 7.3 per cent in real terms. However, this appreciation had effectively been wiped-out when by March 2013 the nominal rate had depreciated by 6.1 per cent and by 5.6 per cent in real terms. Subsequently, there has been a slight appreciation once more. As of September, the nominal rate had risen by 4.5 per cent and the real rate by 4.8 per cent.
While, as recent figures help to demonstrate, the British pound continues on its roller-coaster ride, there has been a very marked depreciation since the giddy-days prior to the financial crisis. The facts show that when comparing the effective exchange rate in September 2013 with July 2007 the British pound was 21.8 per cent lower in nominal terms and 18.3 per cent in real terms. Over the same period, the US dollar, for example, was only 1.3 per cent lower in nominal terms and 6.1 per cent in real terms. This constitutes a major competitive boost for our exporters. Nonetheless, there remain uncertainty about just how much British exporters can take advantage of this, the amount that it will boost British growth and the impact it will make on the country’s chronic balance of trade deficit in goods which was close to 7 per cent of GDP in 2012.
Data
Statistical Interactive Database – interest and exchange rate rates data Bank of England
BIS effective exchange rate indices Bank for International Settlements
Market Data: Currencies BBC News
Recent Articles
Unexpected drop in factory output dents sterling Reuters UK, Jessica Mortimer (9/10/13)
Pound Forecasts Soar as BOE’s Carney Signals Shift: Currencies Bloombeg, Lukanyo Mnyanda and Emma Charlton (19/10/13)
Pound Advances as U.K. Financial Optimism Improves; Gilts Rise Bloombeg, Emma Charlton (7/10/13)
Re-balancing and the re-industrialisation of Britain BBC News, Linda Yueh (13/10/13)
Signs of recovery abound but with little consensus on future course Financial Times, Chris Giles and Sarah O’Connor (31/10/13)
Previous Articles
Pound depreciates Vs dollar to lowest level since Aug 16 Bloomberg, Emma Charlton (5/2/13)
Pound advances against euro on Italy speculation; Gilts decline Bloomberg, Lucy Meakin and David Goodman Alice Ross (4/3/13)
Pounding of sterling risks a currency war Scotland on Sunday, Bill Jamieson (17/2/13)
Credit ratings, the pound, currency movements and you BBC News, Kevin Peachey (25/2/13)
The Bank of England can’t just go on doing down the pound Telegraph, Jeremy Warner (21/2/13)
 Sterling will continue to go down BBC News, Jim Rogers (25/2/13)
Questions
- Explain how the foreign demand for goods and assets generates a demand for British pounds. How will this demand be affected by the foreign currency price of the British pound, i.e. the number of foreign currency units per £1?
- Explain how the demand by British residents for foreign goods and assets generates a supply of British pounds. How will this supply be affected by the foreign currency price of the British pound, i.e. the number of foreign currency units per £1?
- What factors are likely to shift the demand and supply curves for British pounds on the foreign exchange markets?
- Illustrate the effect of a decrease in the demand for British goods and assets on the exchange rate (i.e. the foreign currency price of the British pound) using a demand-supply diagram.
- What is the difference between a nominal and a real effective exchange rate? Which of these is a better indicator of the competitiveness of our country’s exports?
- What factors are likely to have caused the depreciation of the British pound since 2007?
- What is meant by a deficit on the balance of trade in goods?
- What relationship exists between the demand and supply of currencies on the foreign exchange markets and the balance of payments?
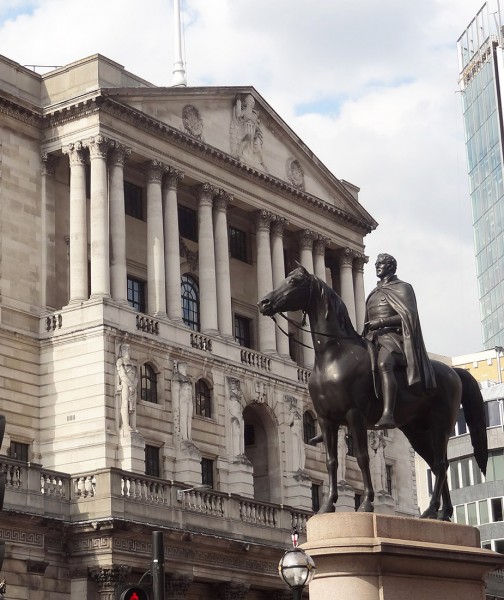 In an interview with the Yorkshire Post, Mark Carney, Governor of the Bank of England, said that under current circumstances he did not feel that further quantitative easing was justified. He said:
My personal view is, given the recovery has strengthened and broadened, I don’t see a case for quantitative easing and I have not supported it.
In response to his speech, the pound strengthened against the dollar. It appreciated by just over 1 cent, or 0.7%. But why should the likelihood of no further quantitative easing lead to a strengthening of the pound?
The answer lies with people’s anticipation of future interest rates. If there is no further increase in money supply through QE, interest rates are likely to rise as the economy recovers and thus the demand for money rises. 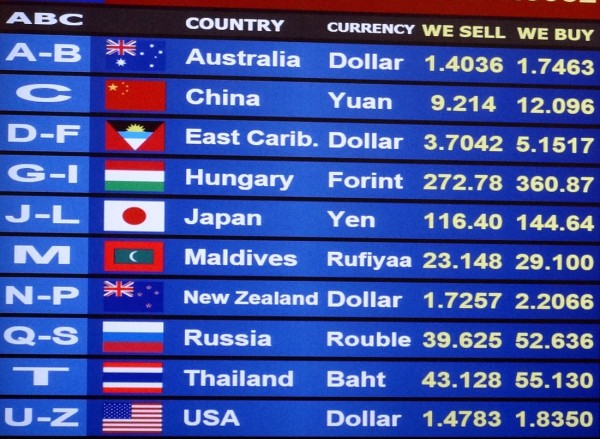 A rise in interest rates, in turn, is likely to lead to an inflow of finance into the country, thereby boosting the financial account of the balance of payments. The increased demand for sterling will tend to drive up the exchange rate.
However, an increase in aggregate demand will result in an increase in imports and a likely increase in the balance of trade deficit. Indeed, in July (the latest figures available) the balance of trade deficit rose to £3.085bn from £1.256bn in June. As recovery continues, the balance of trade deficit is likely to deteriorate further. Other things being equal, this would lead to a depreciation of the pound.
So if the pound appreciates, this suggests that the effect on the financial account is bigger than the effect on the current account – or is anticipated to be so. In fact, given the huge volumes of short-term capital that move across the foreign exchanges each day, financial account effects of interest rate changes – actual or anticipated – generally outweigh current account effects.
Articles
Yorkshire can reap benefits from turnaround says Mark Carney Yorkshire Post (27/9/13)
Sterling Jumps as BOE Chief Signals No More Bond Buying Wall Street Journal, Nick Cawley and Jason Douglas (27/9/13)
Carney’s Northern Exposure Sends Sterling Soaring Wall Street Journal, David Cottle (27/9/13)
Pound Gains as Carney Sees No Case for QE, Confidence Improves Bloomberg, Anchalee Worrachate & David Goodman (28/9/13)
Exchange Rate Bounces as Strong UK Data Supports Sterling FCF (Future Currency Forecast), Laura Parsons (30/9/13)
Currency briefing: What if the pound sterling has been overbought? iNVEZZ, Tsvyata Petkova (30/9/13)
Pound rises after Carney rejects increasing QE BBC News (27/9/13)
Pound Rises for Fourth Day Versus Euro on Housing, Mortgage Data Bloomberg, Emma Charlton (30/9/13)
Data
$ per £ exchange rate (latest month) XE (You can access other periods and currencies)
Effective exchange rate indices (nominal and real) Bank for International Settlements
Balance of Payments, Q2 2013 Dataset ONS
Questions
- Explain how quantitative easing affects exchange rates.
- What is happening concerning quantitative easing in the USA? How is this likely to affect the exchange rate of the US dollar to sterling; other currencies to sterling?
- Why may an increase in the balance of trade deficit lead directly to an appreciation of the exchange rate?
- Why is an anticipation of a policy change likely to have more of an effect on exchange rates than the actual policy change itself? Why, indeed, may a policy change have the reverse effect once it is implemented?
- Under what circumstances may speculation against exchange rate changes be (a) stabilising; (b) destabilising?
- How is quantitative easing (or an anticipation of it) likely to affect each of the main components of the current and financial accounts of the balance of payments?
- For what reasons might sterling have been ‘overbought’ and hence be overvalued?
- What is meant by the real exchange rate (REER)? Why may reference to the REER suggest that sterling is not currently overvalued?
In light of the recent sharp decline in the British pound, this blog is an updated version of Appreciating a depreciating pound which was published in early December 2012. The significance of the depreciation should be seen in the context of the UK as an island-economy which makes trade an important determinant of our economic performance.
The competitiveness of our exports is, in part, affected by the exchange rate. Floating exchange rates are notoriously volatile. However, since the autumn of 2007 we have observed a significant depreciation of the UK exchange rate – a depreciation that seems to have found new momentum of late. A depreciation helps to make our exports more competitive abroad which might help to compensate for weak demand here in the UK.
Rather than look at the British pound (or any currency) against the many foreign currencies separately we can look at the average exchange rate against a whole bundle of currencies. The average rate is calculated by weighting the individual exchange rates by the amount of trade between Britain and the other countries. This trade-weighted exchange rate is known as the effective exchange rate.
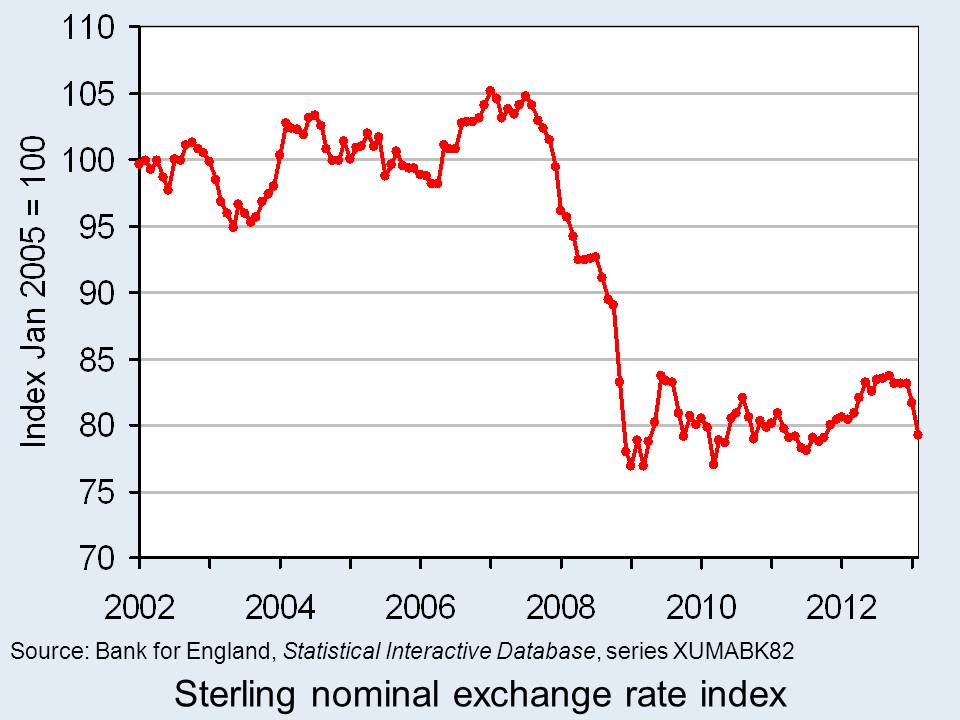
The chart shows the nominal (actual) effective exchange rate for the British pound since 2002. The chart shows clearly how from the autumn of 2007 the effective exchange rate began to fall sharply. Over the period from September 2007 to January 2009, figures from the Bank of England show that the nominal effective exchange rate fell by 25.3 per cent. In simple terms, the British pound depreciated by close to one-quarter. (Click here for a PowerPoint of the chart.)
If we move the clock forward, we observe an appreciation of the British pound between July 2011 (when its value was only 1.6 per cent higher than in January 2009) and September 2012. Over this period, the British pound appreciated by 7.2 per cent. Its value remained relatively stable through much of the remainder of last year. However, we appear to be on another downward path. If we compare the average value in February 2013 with the ‘high’ back in September 2012 we observe a depreciation of 5.4 per cent.
The British pound continues on its roller-coaster ride. Most commentators expect the British pound to fall further. Some see this as an important ingredient for a revival in British economic fortunes. If we compare September 2007 with February 2013, we find that the nominal effective exchange rate for the British pound is 23 per cent lower. This constitutes a major competitive boost for our exporters. However, an important question is whether there is a demand for these goods and services abroad however more attractive the depreciation makes them.
Data
Statistical Interactive Database – interest and exchange rate rates data Bank of England
BIS effective exchange rate indices Bank for International Settlements
Articles
Pound depreciates Vs dollar to lowest level since Aug 16 Bloomberg, Emma Charlton (5/2/13)
Pound advances against euro on Italy speculation; Gilts decline Bloomberg, Lucy Meakin and David Goodman (4/3/13)
Pounding of sterling risks a currency war Scotland on Sunday, Bill Jamieson (17/2/13)
Credit ratings, the pound, currency movements and you BBC News, Kevin Peachey (25/2/13)
The Bank of England can’t just go on doing down the pound Telegraph, Jeremy Warner (21/2/13)
Sterling will continue to go down BBC News, Jim Rogers (25/2/13)
Questions
- Explain how the foreign demand for goods and assets generates a demand for British pounds. How will this demand be affected by the foreign currency price of the British pound, i.e. the number of foreign currency units per £1?
- Explain how the demand by British residents for foreign goods and assets generates a supply of British pounds. How will this supply be affected by the foreign currency price of the British pound, i.e. the number of foreign currency units per £1?
- What factors are likely to shift the demand and supply curves for British pounds on the foreign exchange markets?
- Illustrate the effect of a decrease in the demand for British goods and assets on the exchange rate (i.e. the foreign currency price of the British pound) using a demand-supply diagram.
- What is the difference between a nominal and a real effective exchange rate? Which of these is a better indicator of the competitiveness of our country’s exports
- What factors are likely to have caused the depreciation of the British pound in 2013?
The UK is an island-economy. Therefore, trade is a crucial determinant of our economic performance. The competitiveness of our exports, in part, is affected by the exchange rate. Floating exchange rates are notoriously volatile. However, since the autumn of 2007 we have observed a significant depreciation of the UK exchange rate. In other words the number of units of many foreign currencies to the British pound has fallen. A depreciation helps to make our exports more competitive abroad. We detail the extent of this depreciation and any signs of a reversal in this pattern.
Rather than look at the British pound (or any currency) against the many foreign currencies separately we can look at the average exchange rate against a whole bundle of currencies. The average rate is calculated by weighting the individual exchange rates by the amount of trade between Britain and the other countries. This trade-weighted exchange rate is known as the effective exchange rate.
In analysing the competitiveness of the exchange rate, we can go one step further and adjust for the terms of trade. This means that we adjust for the average price of our exports relative to the average price of those goods we import. Therefore, as well as the nominal (actual) effective exchange rate we can calculate a real effective exchange rate. If the average price of our exports rises relative to the average price of imports, the real effective exchange rate rises relative to the nominal rate. It means that we are able to obtain a larger volume of imports from selling a given volume of exports.
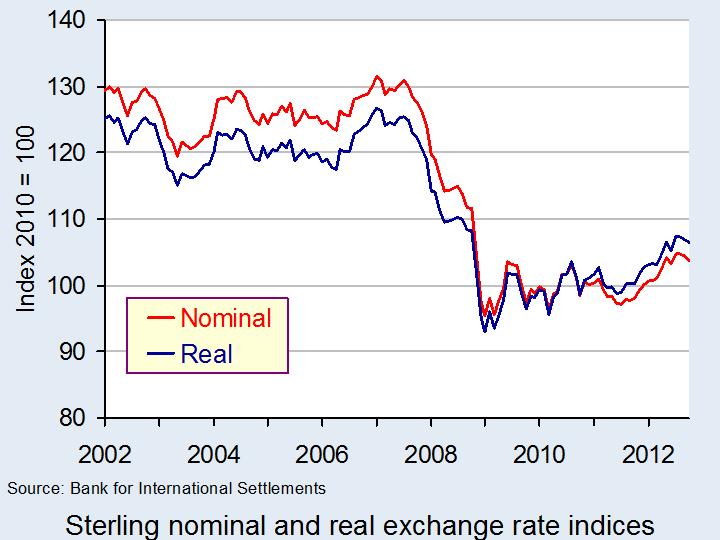 The chart shows the nominal (actual) and real effective exchange rate for the British pound since 2002. The chart shows clearly how from the autumn of 2007 the effective exchange rate both in nominal and real terms began to fall sharply. Over the period from September 2007 to January 2009 the nominal effective exchange rate fell by 26 per cent. After adjusting for the relative price of exports to imports, we find the real effective exchange rate fell by 24 per cent. In other words, the British pound depreciated by close to one-quarter in just 16 months.
If we move the clock forward, we observe a mild appreciation of the British pound since July 2011. In nominal terms, the effective exchange rate has appreciated by 6.8 per cent while in real terms it has appreciated by 7.8 per cent. Nonetheless, if we compare September 2007 with October 2012, we find that the nominal effective exchange rate for the British pound is 19 per cent lower while the real effective exchange rate is approximately 13 per cent lower. This still constitutes a major competitive boost for our exporters.
Data
BIS effective exchange rate indices Bank for International Settlements
Articles
Sterling gains as eurozone weakness prevails Reuters UK, Phillip Baillie (7/12/12)
Pound steady after Autumn Statement Financial Times, Alice Ross (5/12/12)
Sterling at risk after triple-A warning, outlook negative Reuters UK, Phillip Baillie (6/12/12)
Questions
- Explain how the foreign demand for goods and assets generates a demand for British pounds. How will this demand be affected by the foreign currency price of the British pound, i.e. the number of foreign currency units per £1?
- Explain how the demand by British residents for foreign goods and assets generates a supply of British pounds. How will this supply be affected by the foreign currency price of the British pound, i.e. the number of foreign currency units per £1?
- What factors are likely to shift the demand and supply curves for British pounds on the foreign exchange markets?
- Illustrate the effect of a decrease in the demand for British goods and assets on the exchange rate (i.e. the foreign currency price of the British pound) using a demand-supply diagram.
- What is the difference between a nominal and a real effective exchange rate? Which of these is a better indicator of the competitiveness of our country’s exports?
The USA has complained for a long time now that the Chinese currency is undervalued. This makes it hard for American domestic firms to compete with cheap Chinese imports and for US exporters to sell to China. This was a major talking point at the G20 conference in Korea in November 2010: see Seoul traders and the following clip from Reuters: Obama pressures China at G20.
So is the yuan undervalued and, if so, has there been any appreciation to reduce the degree of undervaluation? In 2005, the yuan was pegged at $0.12 (or $1 = ¥8.28). In July 2005 the peg was relaxed and the yuan has appreciated. By mid-December 2010, the yuan was trading at $0.15 (or $1 = ¥6.66) – a 25% appreciation since 2005. In real terms the appreciation has been greater. Chinese inflation is above US inflation. Latest figures for Chinese inflation show consumer prices rising by an annual rate of 5.1%. This compares with 1.2% in the USA. This makes the real appreciation greater.
But despite this appreciation, the USA maintains that the Chinese currency is still considerably undervalued. Estimates for this undervaluation are around 40%. In its latest ‘Big Mac Index’, The Economist calculates this undervaluation at 41.2%. Links to the relevant data are given below. Read the articles and then use the data to answer the questions.
Articles
China’s soaring inflation could hit UK shoppers The Telegraph, Richard Tyler (11/12/10)
China says November inflation rises to 5.1 percent Bloomberg, Cara Anna (11/12/10)
Jump in China inflation keeps focus on tightening Reuters, Aileen Wang and Simon Rabinovitch (11/12/10)
China inflation rise fastest since July 2008, exceeds market forecast The Australian, Aaron Back (11/12/10)
China’s top economic planner says December CPI likely below 5% Xinhuanet (11/12/10)
Yuan rises vs dollar after strong trade data The Economic Times of India (11/12/10)
Who wins if Yuan is significantly revalued? International Business Times (12/12/10)
Currency war reveals growing global fissures AsiaOne (11/12/10)
How China’s Inflation Policy Will Help the Yuan / Dollar Exchange Rate Seeking Alpha, Ed Dolan (29/11/10)
Data
Monthly Data Chinese National Bureau of Statistics
US Inflation Rate in Percent for Jan 2000-Present InflationData.com
BIS effective exchange rate indices Bank for International Settlements
Spot Exchange Rates Bank of England
IMF World Economic Ourlook Data Find The Best
Economic Data freely available online The Economics Network
The Big Mac Index The Economist
Questions
- Using Bank for International Settlements data above (broad indices), plot the nominal and real exchange rate indices for the US dollar and the yuan from 2005 to the present day. How much have (a) the nominal and (b) the real yuan exchange rate indices appreciated against the dollar exchange rate indices? (Note: you can use the Excel data to plot all four series on the same diagram.)
- Why has the Chinese rate of inflation risen?
- How are the anti-inflationary policies being considered by the Chinese authorities likely to impact on (a) the yuan exchange rate (b) the Chinese current account?
- In what ways do the Chinese authorities intervene in the foreign exchange market?
- What are the implications of the People’s Bank of China increasing the amount of yuan that can be traded on currency markets and increasing the amount of yuan-denominated debt?
- What are meant by purchasing power parity (PPP) exchange rates? Is the Big Mac index a good guide to the degree to which a currency is under- or overvalued?
 Compared with pre-financial crisis levels, the British pound is significantly weaker when measured against a basket of foreign currencies. In this blog we provide a further update of Appreciating a depreciating pound which was published back in early December 2012. The significance of the depreciation should be seen in the context of the UK as an open, island-economy where the ratio of exports to GDP in 2012 was close to 32%.