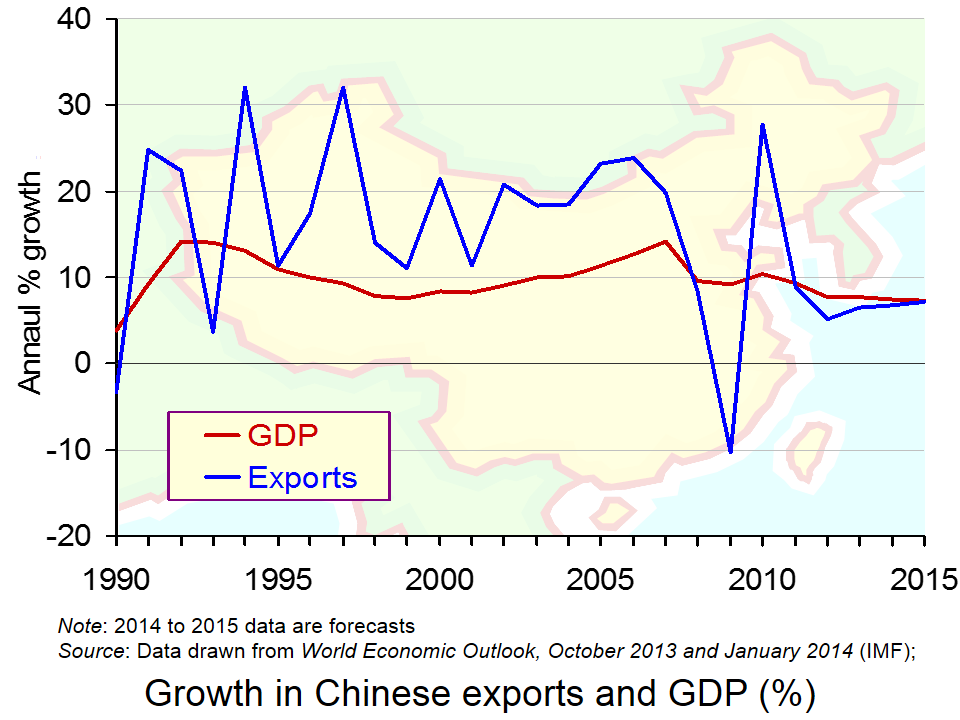
 The growth of China over the past decade has been quite phenomenal, with figures recorded in double-digits. However, in the aftermath of the recession, growth has declined to around 7% – much higher than Western economies are used to, but significantly below the ‘norm’ for China. (Click here for a PowerPoint of the chart.)
The growth target for this year is 7.5%, but there appear to be some concerns about China’s ability to reach this figure and this has been emphasised by a recent Chinese policy.
A mini-stimulus package has been put in place, with the objective of meeting the 7.5% growth target. Government expenditure is a key component of aggregate demand and when other components of AD are lower than expected, boosting ‘G’ can be a solution. However, it’s not something that the Chinese government has had to do in recent years and the fact that this stimulus package has been put in place has brought doubts over China’s economic performance to the forefront , but has confirmed its commitment to growth. Mizuho economist, Shen Jianguang, said:
It’s very obvious that the leaders feel the need to stabilise growth…Overall, the 7.5 per cent growth target means that the government still cares a lot about economic growth.
Data suggest that growth in China is relatively weak and there are concerns that the growth target will be missed, hence the stimulus package. In the aftermath of the 2008 financial crisis, there was a large stimulus package in place in China. This latest investment by the government is in no way comparable to the size of the 2008 package, but instead will be on a smaller and more specific scale. Mark Williams of Capital Economics said:
It’s a bit of a rerun of what we saw last year – something less than a stimulus package and more of piecemeal measures to ensure they reach their growth target.
It is the construction of public housing and railways that will be the main areas of investment this time round. A sum of $120–180bn per year will be available for railway construction and $161bn for social housing, and tax breaks are being extended for small businesses.
The 2008 stimulus package saw debt increase to some 200% of GDP, which did cause growing concerns about the reliance on debt. However, this latest package will be financed through the issue of bonds, which is much more similar to how market economies finance spending.
The fact that the government has had to intervene with such a stimulus package is, however, causing growing concerns about the level of debt and the future of this fast growing economy, though the new method of financing is certainly seen as progress.

It should be noted that a decline in growth for China is not only concerning for China itself, but is also likely to have adverse consequences other countries. In the increasingly interdependent world that we live in, Western countries rely on foreign consumers purchasing their exports, and in recent years it has been Chinese consumers that have been a key component of demand. However, a decline in growth may also create some benefits – resources may not be used up as quickly and prices of raw materials and oil in particular may remain lower.
It is certainly too early for alarm bells, but the future of China’s growth is less certain than it was a decade ago. The following articles consider this issue.
China’s new mini-stimulus offers signs of worry and progress BBC News, Linda Yueh (3/4/14)
China puts railways and houses at hear of new stimulus measures The Guardian (3/4/14)
China unveils mini stimulus to to boost slowing economy The Telegraph (3/4/14)
China stimulus puts new focus on growth target Wall Street Journal, Bob Davis and Michael Arnold (3/4/14)
China embarks on ‘mini’ stimulus programme to kick-start economy Independent, Russell Lynch (3/4/14)
China takes first step to steady economic growth Reuters (2/4/14)
China unveils fresh stimulus The Autstralian (3/4/14)
China’s reformers can triumph again, if they follow the right route The Guardian, Joseph Stiglitz (2/4/14)
Questions
- How has Chinese growth reached double-digits? Which factors are responsible for such high growth?
- The BBC News article suggests that the stimulus package is cause for concerns but also shows progress. How can it do both?
- Using a diagram, illustrate how a stimulus package can boost economic growth.
- What are the advantages and disadvantages of high rates of growth for (a) China and (b) Western economies?
- Why does the method of financing growth matter?
- Railway and housing construction have been targeted to receive additional finance. Why do you think these sectors have been targeted?
 With the publication of the February 2014 Inflation Report the Bank of England has adjusted its forward guidance to the markets.
As we saw in Part 1 of this blog, the economy should soon fall below the 7% unemployment threshold adopted in the original forward guidance issued last August. But the Bank feels that there is still too much slack in the economy to raise interest rates when unemployment does fall below 7%.
The Bank has thus issued a new vaguer form of forward guidance.
The MPC’s view is that the economy currently has spare capacity equivalent to about 1%–1½% of GDP, concentrated in the labour market. Around half of that slack reflects the difference between the current unemployment rate of 7.1% and an estimate of its
medium-term equilibrium rate of 6%–6½%. The remaining slack largely reflects a judgement that employees would like to work more hours than is currently the case. Companies appear to be operating at close to normal levels of capacity, although this is subject to some uncertainty.
The existence of spare capacity in the economy is both wasteful and increases the risk that inflation will undershoot the target in the medium term. Moreover, recent developments in inflation mean that the near-term trade-off between keeping inflation close to the target and supporting output and employment is more favourable than at the time the MPC announced its guidance last August: CPI inflation has fallen back to the 2% target more quickly than anticipated and, with domestic costs well contained, is expected to remain at, or a little below, the target for the next few years. The MPC therefore judges that there remains scope to absorb spare capacity further before raising Bank Rate.
Just what will determine the timing and pace of tightening? The Bank identifies three factors: the sustainability of the recovery; the extent to which supply responds to demand; and the evolution of cost and price pressures. But there is considerable uncertainty about all of these.
Thus although this updated forward guidance suggests that interest rates will not be raised for some time to come, even when unemployment falls below 7%, it is not at all clear when a rise in Bank Rate is likely to be, and then how quickly and by how much Bank Rate will be raised over subsequent months. Partly this is because of the inevitable uncertainty about future developments in the economy, but partly this is because it is not clear just how the MPC will interpret developments.
So is this new vaguer forward guidance helpful? The following articles address this question.
Articles
Bank of England Governor Carney’s statement on forward guidance Reuters (12/2/14)
Why has Mark Carney tweaked forward guidance? The Telegraph, Denise Roland (12/2/14)
Interest rates: Carney rips up ‘forward guidance’ policy Channel 4 News (12/2/14)
Forward guidance version 2: will the public believe it? The Guardian, Larry Elliott (12/2/14)
Mark Carney adjusts Bank interest rate policy BBC News (12/2/14)
Mark Carney’s almost promise on rates BBC News, Robert Peston (12/2/14)
Did the Bank of England’s Forward Guidance work? Independent, Ben Chu (2/2/14)
Forward Guidance 2.0: Is Carney just digging with a larger shovel? Market Watch, The Tell (12/2/14)
The U.K. Economy: Five Key Takeaways Wall Street Journal, Alen Mattich (12/2/14)
Bank of England pages
Inflation Report, February 2014 Bank of England (12/2/14)
Monetary Policy Bank of England
MPC Remit Letters Bank of England
Forward Guidance Bank of England
Questions
- Summarize the new forward guidance given by the Bank of England.
- Why is credibility an important requirement for policy?
- What data would you need to have in order to identify the degree of economic slack in the economy?
- Why is it difficult to obtain such data – at least in a reliable form?
- What is meant by the ‘output gap’? Would it be a good idea to target the output gap?
- Is it possible to target the rate of inflation and one or more other indicators at the same time? Explain.
 Although the Monetary Policy Committee (MPC) of the Bank of England is independent in setting interest rates, until recently it still had to follow a precise remit set by the government. This was to target inflation of 2% (±1%), with interest rates set to meet this target in 24 months’ time. But things have changed since the new Governor, Mark Carney, took up office in July 2013. And now things are not so clear cut.
The Bank announced that it would keep Bank Rate at the current historically low level of 0.5% at least until unemployment had fallen to 7%, subject to various conditions. More generally, the Bank stated that:
The MPC intends at a minimum to maintain the present highly stimulative stance of monetary policy until economic slack has been substantially reduced, provided this does not entail material risks to price stability or financial stability.
This ‘forward guidance’ was designed to provide more information about future policy and thereby more certainty for businesses and households to plan.
But unemployment has fallen rapidly in recent months. It fell from a 7.7% average for the three months May to July 2013 to 7.1% for the latest available three months (September to November 2013).  And yet there is still considerable slack in the economy.
It now, therefore, looks highly unlikely that the MPC will raise Bank Rate as soon as unemployment falls below 7%. This then raises the question of how useful the 7% target has been and whether, if anything, it has created further uncertainty about future MPC decisions.
The following still appears on the Bank of England website:
The MPC intends at a minimum to maintain the present highly stimulative stance of monetary policy until economic slack has been substantially reduced, provided this does not entail material risks to price stability or financial stability.
But this raises two questions: (a) how do you measure ‘economic slack’ and (b) what constitutes a substantial reduction?
So what should the Bank do now? What, if any, forward guidance should it offer to the markets? Will that forward guidance be credible? After all, credibility among businesses and households is an important condition for any policy stance. According to Larry Elliott in the first article below, there are five options.
Articles
Bank of England’s method of setting interest rates needs reviewing The Guardian, Larry Elliott (9/2/14)
Mark Carney set to adjust Bank interest rate policy BBC News (12/2/14)
Forward guidance: dead and alive BBC News, Robert Peston (11/2/14)
What “forward guidance” is, and how it (theoretically) works The Economist (11/2/14)
BOE’s forward guidance 2.0: Cheap talk, or big change? Market Watch (11/2/14)
Bank of England pages
Monetary Policy Bank of England
MPC Remit Letters Bank of England
Forward Guidance Bank of England
Questions
- What data would you need to have in order to identify the degree of economic slack in the economy?
- Why is it difficult to obtain such data – at least in a reliable form?
- Why might the issuing of the forward guidance last July have itself contributed to the fall in unemployment?
- Why is it difficult to obtain such data – at least in a reliable form?
- Why is credibility an important requirement for policy?
- Why may LFS unemployment be a poor guide to the degree of slack in the economy?
- Discuss the relative merits of each of the five policy options identified by Larry Elliott.
 It is rising inflation that typically causes problems for countries, whether it is demand-pull or cost-push. However, one country that has not been subject to problems of rising prices is Japan. Instead, this economy has been suffering from the gloom of deflation for many years and many argue that this is worse than high inflation.
Falling prices are popular among consumers. If you see a product whose price has fallen from one day to the next, you can use your income to buy more goods. What’s the problem with this? The Japanese economy has experienced largely stagnant growth for two decades and a key cause has been falling prices. When the prices of goods begin to fall over and over again, people start to form expectations about the future direction of prices. If I expect the price of a good to fall next week, then why would I buy now, if I can buy the same good next week at a lower price?  But, when next week arrives and the price has fallen as expected, why would I purchase the product, if I think that the price fall is set to continue? The problem of deflation is that with continuously falling prices, consumers stop spending. Aggregate demand therefore declines and economic growth all but disappears. This is the problem that the Japanese economy has been faced with for more than 20 years.
However, the latest data from Japan shows core consumer prices growing faster than expected in December 2013, compared to the previous year. This figure was above market forecasts and was the fastest rate of growth in the past 5 years. These data, together with those on unemployment have given the economy a much needed boost.
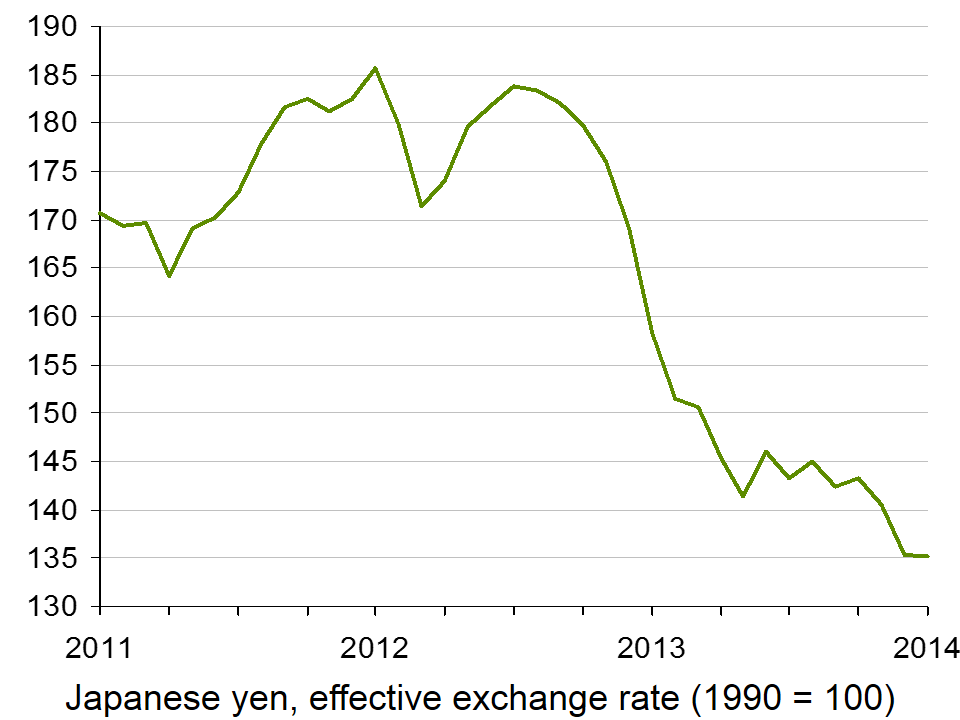 Recent government policy has been focused on boosts in government spending, with an aim of reducing the value of the currency (click here for a PowerPoint of the chart). Such policies will directly target aggregate demand and this in turn should help to generate an increase in national output and push up prices. If the price trend does begin to reverse, consumers will start to spend and again aggregate demand will be stimulated.
The future of the economy remains uncertain, though the same can be said of many Western economies. However, the signs are good for Japan and if the recovery of other economies continues and gathers pace, Japan’s export market will be a big contributor to recovery. The following articles consider the Japanese economy.
Japan inflation rises at fastest pace in over five years BBC News (31/1/14)
Benchmark Japan inflation rate hits 1.3% Financial Times, Jonathan Soble (31/1/14)
Japan’s inflation accelerates as Abe seeks wage gains Bloomberg, Chikako Mogi, Masahiro Hidaka and James Mayger (31/1/14)
Japan inflation quickens to over 5-year high, output rebounds Reuters, Leika Kihara and Stanley White (31/1/14)
Japaense inflation rises at fastest pace in over five years at 1.3% in December 2013 Independent, Russel Lynch (31/1/14)
 Why Abenomics holds lessons for the West BBC News, Linda Yueh (18/12/13)
Questions
- Why is deflation a problem?
- Using an AD/AS diagram, illustrate the problem of expectations and how this contributes to stagnant growth.
- How will a lower currency help Japan?
- What is the likely effect of a sales tax being imposed?
- Does the fact that unemployment has declined support the fact that consumer prices are beginning to rise?
- What government policies would you recommend to a government faced with stagnant growth and falling prices?
- How important are expectations in creating the problem of deflation?
 Politicians often make use of economic statistics to promote their point of view. A good example is a claim made by the UK Prime Minister on 23 January 2014. According to the latest statistics, he said, most British workers have seen their take-home pay rise in real terms. The Labour party countered this by arguing that incomes are not keeping up with prices.
So who is right? Studying economics and being familiar with analysing economic data should help you answer this question. Not surprisingly, the answer depends on just how you define the issue and what datasets you use.
The Prime Minister was referring to National Statistics’ Annual Survey of Hours and Earnings (ASHE). This shows that in April 2013 median gross weekly earnings for full-time employees were £517.5, up 2.25% from £506.10 in 2012, and mean gross weekly earnings for full-time employees were £620.30, up 2.06% from £607.80 in 2012 (see Table 1.1a in the dataset). CPI inflation over this period was 2.4%, representing a real fall in median gross weekly earnings of 0.15% and mean gross weekly earnings of 0.34%.
But when adjustments are made for increases in personal income tax allowances, then, according to the government, except for the richest 10% of the working population, people had an average increase in real take-home pay of 1.1%.
But does this paint the complete picture? Critics of the government’s claim that people are ‘better off’, make the following points.
First, the ASHE dataset is for the year ending April 2013. The ONS publishes other datasets that show that real wages have fallen faster since then. The Earnings and Working Hours datasets, published monthly, currently go up to November 2013. 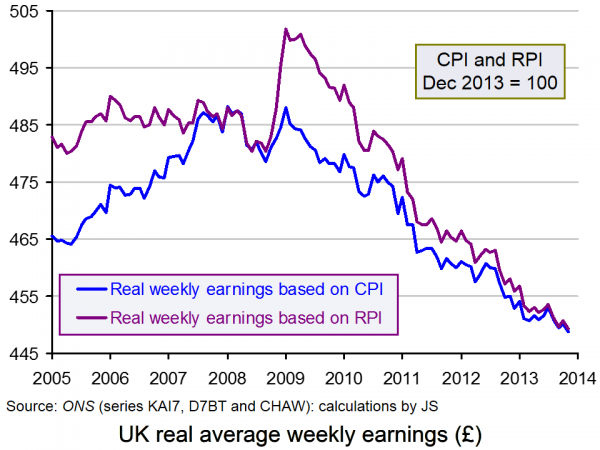 The chart shows real wages from January 2005 to November 2013 (with CPI = 100 in December 2013). You can see that the downward trend resumed after mid 2013. In the year to November 2013, nominal average weekly earnings rose by 0.9%, while CPI inflation was 2.1%. Thus real weekly earnings fell by 1.2% over the period (click here for a PowerPoint of the chart).
Second, there is the question of whether CPI or RPI inflation should be used in calculating real wages. RPI inflation was 2.9% (compared to CPI inflation of 2.4%) in the year to April 2013. The chart shows weekly earnings adjusted for both CPI and RPI.
Third, if, instead of looking at gross real wages, the effect of income tax and national insurance changes are taken into account, then benefit changes ought also to be taken into account. Some benefits, such as tax credits and child benefit were cut in the year to April 2013.
Fourth, looking at just one year (and not even the latest 12 months) gives a very partial picture. It is better to look at a longer period and see what the trends are. The chart shows the period from 2005. Real wages (CPI adjusted) are 8.0% lower than at the peak (at the beginning of 2009) and 5.0% lower than at the time of the election in 2010. The differences are even greater if RPI-adjusted wages are used.
But even if the claim that real incomes are rising is open to a number of objections, it may be that as the recovery begins to gather pace, real incomes will indeed begin to rise. But to assess whether this is so will require a careful analysis of the statistics when they become available.
Articles
UK pay rising in real terms, says coalition BBC News (24/1/14)
Are we really any better off than we were? BBC News, Brian Milligan (24/1/14)
Government take-home pay figures ‘perfectly sensible’ BBC Today Programme, Paul Johnson (24/1/14)
Take-Home Pay ‘Rising Faster Than Prices’ Sky News, Darren McCaffrey (25/1/14)
David Cameron hails the start of ‘recovery for all’ The Telegraph, Peter Dominiczak (23/1/14)
Is take-home pay improving? The answer is anything but simple The Guardian, Phillip Inman and Katie Allen (24/1/14)
Cameron’s ‘good news’ about rising incomes is misleading says Labour The Guardian, Rowena Mason (24/1/14)
The Tories’ claim that living standards have risen is nonsense on stilts New Statesman, George Eaton (24/1/14)
FactCheck: Conservative claims on rising living standards Channel 4 News, Patrick Worrall (25/1/14)
Living standards squeeze continues in UK, says IFS BBC News (31/1/14)
Richest have seen biggest cash income squeeze but poorest have faced higher inflation IFS Press Release (31/1/14)
Data
Average Weekly Earnings dataset ONS (22/1/14)
Annual Survey of Hours and Earnings, 2013 Provisional Results ONS (12/12/13)
Consumer Price Inflation, December 2013 ONS (14/1/14)
Inequality and Poverty Spreadsheet Institute for Fiscal Studies
An Examination of Falling Real Wages, 2010 to 2013 ONS (31/1/14)
Questions
- Why are mean weekly earnings higher than median weekly earnings?
- Explain the difference between RPI and CPI. Which is the more appropriate index for determining changes in real incomes?
- Find out what benefit changes have taken place over the past two years and how they have affected household incomes.
- How have gross weekly earnings changed for the different income groups? (The ASHE gives figures for decile groups.)
- Which is better for assessing changes in incomes: weekly earnings or hourly earnings?
- How would you define a change in living standards? What data would you need to be able to assess whether living standards have increased or decreased?