 The eurozone is certainly in trouble and, despite the efforts of world leaders to create confidence, it appears that most announcements are having the opposite effect. The risk of deflation has now emerged to be very true; the powerhouse of Europe ‘needs to do more’ and the euro has fallen following Mario Draghi’s recent comments. So, just how bad are things in the eurozone?
Mario Draghi suggested that as a means of stimulating the eurozone economies, a process of quantitative easing may soon need to begin. However, rather than reassuring investors that action was being taken to improve the economic performance in the region, it appears to have had the opposite effect. Following his comments, the euro fell to its lowest level since the middle of 2010.
Quantitative easing has seen much use in the aftermath of the financial crisis and the aim in the eurozone would be to put a stop to the continuing price decreases. The eurozone has now entered deflation and, while the aim of this economic area has always been low prices, deflation is not good news. The downward pressure on prices has been largely driven by oil prices falling and prices in other areas remaining relatively stable.
Quantitative easing would inject money into the eurozone, thus creating growth (or at least that’s the idea) and pushing up prices. One of Mario Draghi’s comments was:
‘We are making technical preparations to alter the size, pace and composition of our measures in early 2015.’
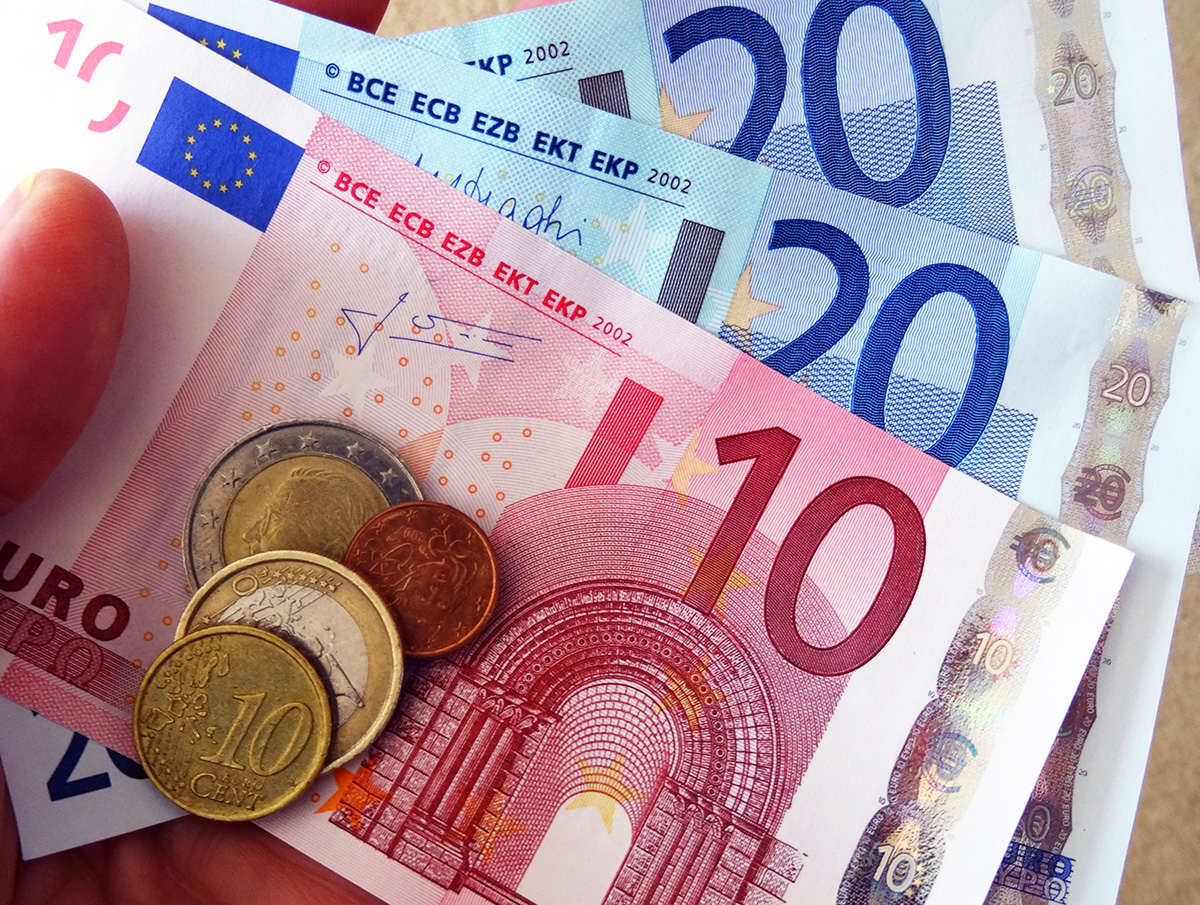
 So, while it’s not certain that the QE policy will be used, it seems pretty likely, especially as this policy has been floating around for almost a year.
A key question is, will it work? The quantity theory of money does suggest that an increase in the money supply will lead to inflationary pressures, unless its velocity of circulation falls. But will it actually stimulate aggregate demand and economic growth? If there is more money in the banking system and hence more money available for lending then it may well stimulate investment and consumption. However, if consumers and firms are not confident about the effectiveness of the policy or about the future of the economy, then will the fact that more money is available for lending actually encourage them to borrow? In this case will there merely be a fall in the velocity of circulation?
The comments by Mario Draghi have also caused the euro to fall to its lowest level since 2010. The graph included in the CNBC article provides an interesting view of the path of the euro. Marc Chandler, from Brown Brothers Harriman said:
‘I’d say there’s a good chance it [the euro] gets there [parity with the dollar] before the election next November (2016) … We know the Fed’s going to be raising rates sooner or later, and the ECB is going to be easing sooner or later. I just see a steady grind lower.’
The outlook of the euro therefore doesn’t look too good by all accounts. It is now a waiting game to see if the policy of quantitative easing is implemented and whether or not it has the desired effect. The following articles consider this topic.
Eurozone economy slows further BBC News (6/1/15)
Eurozone falls into deflation for first time since October 2009 Financial Times, Claire Jones (7/1/15)
Eurozone officially falls into deflation, piling pressure on ECB The Telegraph, Marion Dakers (7/1/15)
Eurozone consumer prices fall for first time in five years Nasdaq, Brian Blackstone and Paul Hannon (7/1/15)
Draghi comments send euro to lowest level since 2010 BBC News (2/1/15)
Oil slump drags Eurozone into deflation The Guardian, Graeme Wearden (7/1/15)
Eurozone prices fall more than expected in December Reuters (7/1/15)
Eurozone lurches into deflation after oil price crashes Independent, Russell Lynch (7/1/15)
German inflation hits five-year low as Eurozone prepares for QE The Telegraph, Mehreen Khan (5/1/15)
Euro slide could take it to parity with dollar CNBC, Patti Domm (7/1/15)
Questions
- Why is deflation a cause for concern when normally the main problem is inflation that is too high?
- What is the quantity theory of money and how does it suggest an increase in the money supply will affect prices?
- If quantitative easing is implemented, is it likely to have the desired effect? Explain why or why not.
- Why has the euro been affected by Mario Draghi’s comments? Use a diagram to help your explanation.
- How will quantitative easing help to stimulate economic growth across the Eurozone? Are there any other policies that would be effective?
- Oil prices have had a big influence on the deflationary pressures in the Eurozone. If oil prices increased again, would this be sufficient to create inflation?
 What is the relationship between the degree of inequality in a country and the rate of economic growth? The traditional answer is that there is a trade off between the two. Increasing the rewards to those who are more productive or who invest encourages a growth in productivity and capital investment, which, in turn, leads to faster economic growth. Redistribution from the rich to the poor, by contrast, is argued to reduce incentives by reducing the rewards from harder work, education, training and investment. Risk taking, it is claimed, is discouraged.
Recent evidence from the OECD and the IMF, however, suggests that when income inequality rises, economic growth falls. Inequality has grown massively in many countries, with average incomes at the top of the distribution seeing particular gains, while many at the bottom have experienced actual declines in real incomes or, at best, little or no growth. 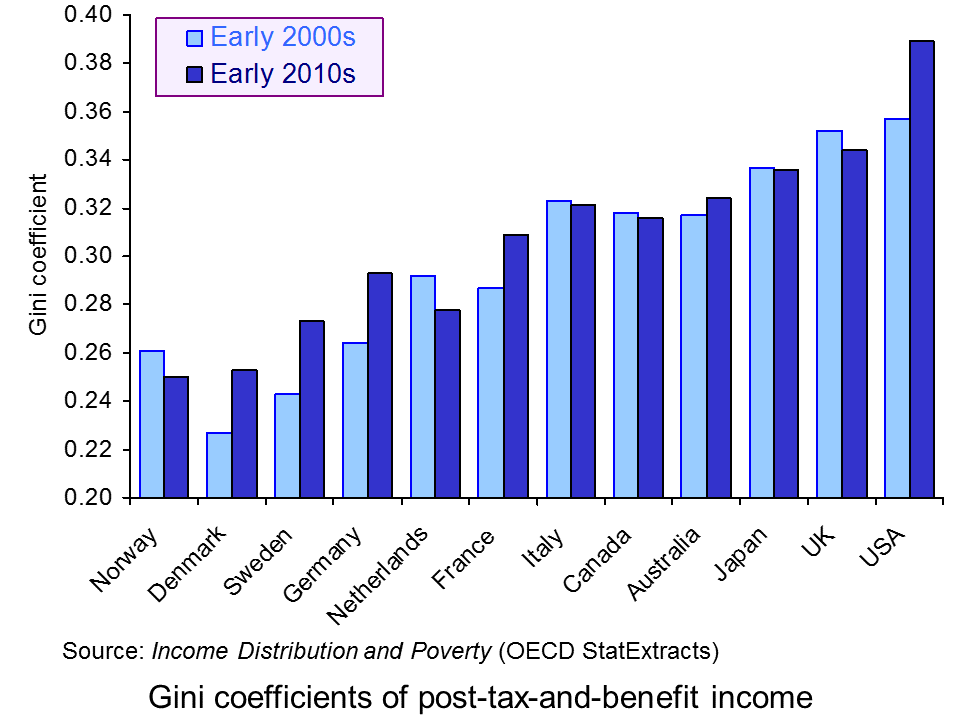 This growth in inequality can be seen in a rise in countries’ Gini coefficients. The OECD average Gini coefficient rose from 0.29 in the mid-1980s to 0.32 in 2011/12. This, claims the OECD, has led to a loss in economic growth of around 0.35 percentage points per year.
But why should a rise in inequality lead to lower economic growth? According to the OECD, the main reason is that inequality reduces the development of skills of the lower income groups and reduces social mobility.
By hindering human capital accumulation, income inequality undermines education opportunities for disadvantaged individuals, lowering social mobility and hampering skills development.
The lower educational attainment applies both to the length and quality of education: people from poorer backgrounds on average leave school or college earlier and with lower qualifications.
But if greater inequality generally results in lower economic growth, will a redistribution from rich to poor necessarily result in faster economic growth? According to the OECD:
Anti-poverty programmes will not be enough. Not only cash transfers but also increasing access to public services, such as high-quality education, training and healthcare, constitute long-term social investment to create greater equality of opportunities in the long run.
Thus redistribution policies need to be well designed and implemented and focus on raising incomes of the poor through increased opportunities to increase their productivity. Simple transfers from rich to poor via the tax and benefits system may, in fact, undermine economic growth. According to the IMF:
That equality seems to drive higher and more sustainable growth does not in itself support efforts to redistribute. In particular, inequality may impede growth at least in part because it calls forth efforts to redistribute that themselves undercut growth. In such a situation, even if inequality is bad for growth, taxes and transfers may be precisely the wrong remedy.
Articles
Inequality ‘significantly’ curbs economic growth – OECD BBC News (9/12/14)
Is inequality the enemy of growth? BBC News, Robert Peston (6/10/14)
Income inequality damages growth, OECD warns Financial Times, Chris Giles (8/10/14)
OECD finds increasing inequality lowers growth Deutsche Welle, Jasper Sky (10/12/14)
Revealed: how the wealth gap holds back economic growth The Guardian, Larry Elliott (9/12/14)
Inequality Seriously Damages Growth, IMF Seminar Hears IMF Survey Magazine (12/4/14)
Warning! Inequality May Be Hazardous to Your Growth iMFdirect, Andrew G. Berg and Jonathan D. Ostry (8/4/11)
Economic growth more likely when wealth distributed to poor instead of rich The Guardian, Stephen Koukoulas (4/6/15)
So much for trickle down: only bold reforms will tackle inequality The Guardian, Larry Elliott (21/6/15)
Videos
Record inequality between rich and poor OECD on YouTube (5/12/11)
The Price of Inequality The News School on YouTube, Joseph Stiglitz (5/10/12)
Reports and papers
FOCUS on Inequality and Growth OECD, Directorate for Employment, Labour and Social Affairs (December 2014)
Trends in Income Inequality and its Impact on Economic Growth OECD Social, Employment and Migration Working Papers, Federico Cingano (9/12/14)
An Overview of Growing Income Inequalities in OECD Countries: Main Findings OCED (2011)
Redistribution, Inequality, and Growth IMF Staff Discussion Note, Jonathan D. Ostry, Andrew Berg, and Charalambos G. Tsangarides (February 2014)
Measure to Measure Finance and Development, IMF, Jonathan D. Ostry and Andrew G. Berg (Vol. 51, No. 3, September 2014)
Data
OECD Income Distribution Database: Gini, poverty, income, Methods and Concepts OECD
The effects of taxes and benefits on household income ONS
Questions
- Explain what are meant by a Lorenz curve and a Gini coefficient? What is the relationship between the two?
- The Gini coefficient is one way of measuring inequality. What other methods are there? How suitable are they?
- Assume that the government raises taxes to finance higher benefits to the poor. Identify the income and substitution effects of the tax increases and whether the effects are to encourage or discourage work (or investment).
- Distinguish between (a) progressive, (b) regressive and (c) proportional taxes?
- How will the balance of income and substitution effects vary in each of the following cases: (a) a cut in the tax-free allowance; (b) a rise in the basic rate of income tax; (c) a rise in the top rate of income tax? How does the relative size of the two effects depend, in each case, on a person’s current income?
- Identify policy measures that would increase both equality and economic growth.
- Would a shift from direct to indirect taxes tend to increase or decrease inequality? Explain.
- By examining Tables 3, 26 and 27 in The Effects of Taxes and Benefits on Household Income, 2012/13, (a) explain the difference between original income, gross income, disposable income and post-tax income; (b) explain the differences between the Gini coefficients for each of these four categories of income in the UK.
 The housing market was at the heart of the 2014 Autumn Statement. Perhaps most eyecatching were the reforms to stamp duty. Stamp Duty is a tax on house purchases. Overnight we have seen the introduction of a graduated system of tax, along the lines of the income tax system – similar to the model to be adopted in Scotland from next April under the Land and Buildings Transactions Tax. For the rest of the UK, there will be five tax bands, including a zero rate band for property values up to £125,000. The total tax liability will be dependent upon the proportion of the value of the property that falls in each taxable band.
But, alongside the Stamp Duty announcement, the Autumn Statement was noteworthy for its references to new build. New build is clearly central to UK housing policy.
The Autumn Statement reaffirmed the government’s wish to see house building play a central role in easing pressures on the housing market. Over the past 40 years or more UK house prices have been characterised by considerable volatility and by a significant real increase. This can be seen clearly in the chart. 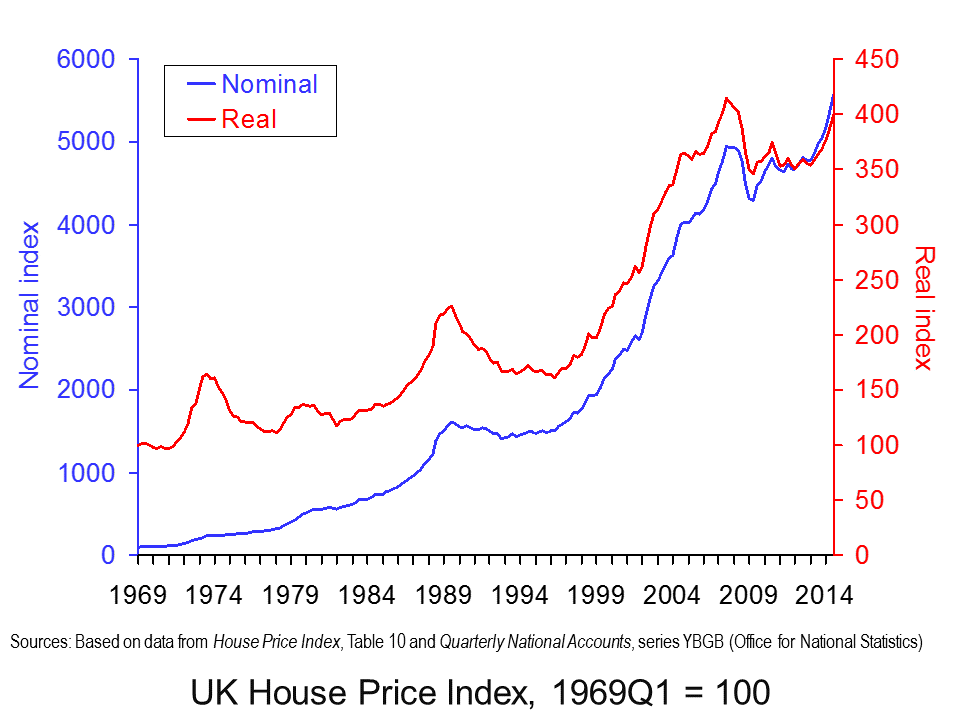 Actual (nominal) house prices across the UK have grown an average rate of 10 per cent per year. Even if we strip out the effect of economy-wide inflation, we are still left with an increase of around 3.5 per cent per year. (Click here to download a PowerPoint of the chart).
The economics point to supply-side problems that mean demand pressures feed directly into house prices. The commitment to build has now seen the announcement of a new garden city near Bicester in Oxfordshire. This is set to provide 13,000 or more new homes. The government has also pledged £100 million to the Ebbsfleet Garden City project to provide the infrastructure and land remediation necessary to bring in more private-sector developers to help deliver an expected 15,000 new homes.
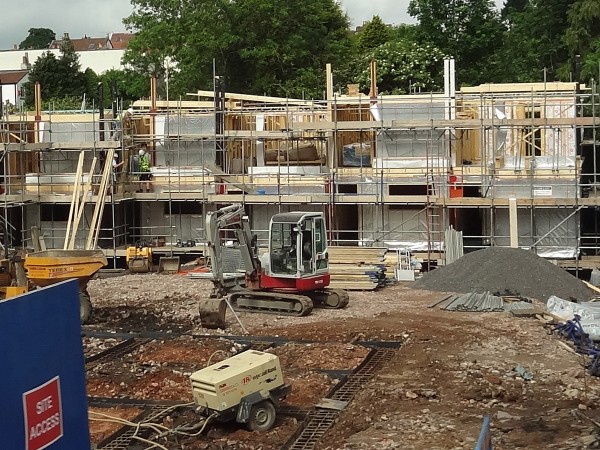 An interesting development in housing policy is the willingness of government to consider being more actively involved itself in house building. The development of former barracks at Northstowe in Cambridgeshire will be spearheaded by the Homes and Communities Agency which will lead on the planning and construction of up to 10,000 new homes. This signals, at least on paper, that government is prepared to think more broadly about the way in which it works with the private sector in helping to deliver new homes.
The desire to facilitate new build appears to make some economic sense. But, the politics of delivering on new homes is considerably more difficult since the prospect of new developments naturally raises considerable local concerns. Furthermore, it does not deal with fundamental questions around the existing housing market stock. In particular, how we can further increase investment in our existing housing stock, especially given the significant land constraints that face a country like the UK. As yet, the debate around how to improve what we already have has not really taken place.
Autumn Statement
Autumn Statement: documents Gov.UK
Articles
Autumn Statement: Government will build tens of thousands of new homes Independent, Nigel Morris (2/12/14)
Government could build and sell new homes on public sector land Guardian, Patrick Wintour (2/12/14)
Bicester chosen as new garden city with 13,000 homes BBC News, (2/12/14)
Nick Clegg reveals coalition plan for new garden city in Oxfordshire Guardian, (2/12/14)
State to build new homes for first time in generation Telegraph, Steven Swinford (2/12/14)
Data
House Price Indices: Data Tables Office for National Statistics
Questions
- Explain the distinction between real and nominal house prices.
- Would you expect real house price inflation to always be less than nominal house price inflation?
- What factors are likely to affect housing demand?
- What factors are likely to affect housing supply?
- Show using a demand-supply diagram the impact of rising incomes on the demand for a particular housing market characterised by a price inelastic supply.
- Would we expect all housing markets to exhibit similar characteristics of housing demand and supply?
- What is the economic rationale for the government’s new build policy?
- What other measures could be introduced to try and alleviate the long-term pressure on real house prices?
- How might we go about assessing the affordability of housing?
- Would a policy which reduced for the stamp duty payment of most buyers help to curb inflationary pressures in the housing market? Explain your answer using a demand-supply diagram.
The eurozone is made up of 18 countries (19 in January) and, besides sharing a common currency, they also seem to be sharing the trait of weak economic performance. The key macroeconomic variables across the eurozone nations have all seemingly been moving in the wrong direction and this is causing a lot of concern for policy-makers.
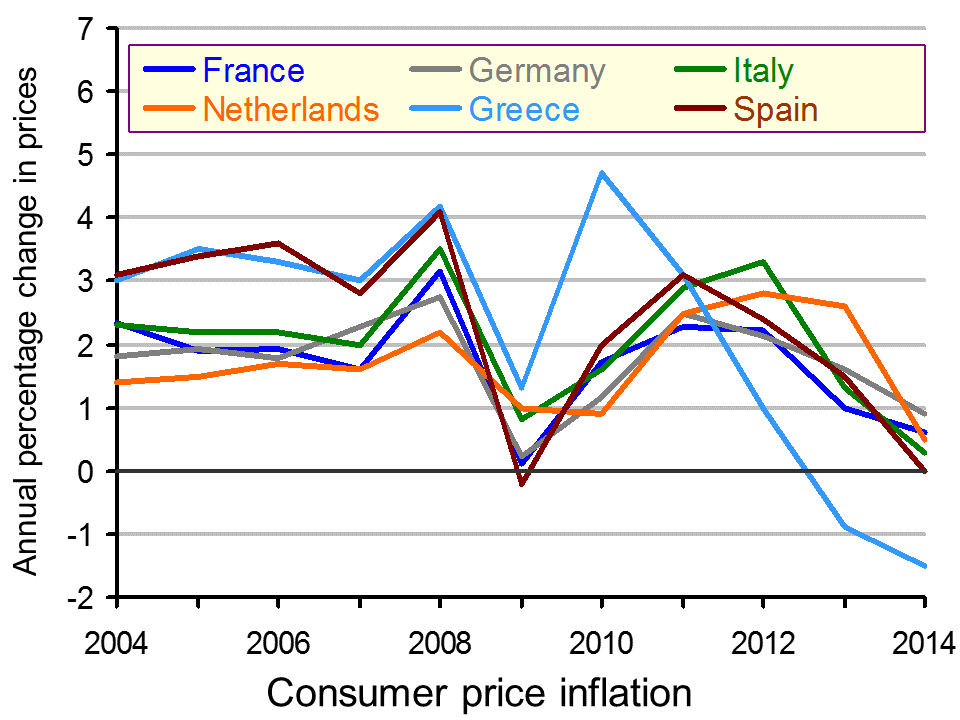
Some of the biggest players in the eurozone have seen economic growth on the down-turn, unemployment rising and consumer and business confidence falling once again. Germany’s economic growth has been revised down and in Italy, unemployment rose to a record of 13.2% in September and around 25% of the workforce remains out of work in Spain and Greece. A significant consequence of the sluggish growth across this 18-nation bloc of countries is the growing risk of deflation.
Whilst low and stable inflation is a macroeconomic objective across nations, there is such a thing as inflation that is too low. When inflation approaches 0%, the spectre of deflation looms large (see the blog post Deflation danger). The problem of deflation is that when people expect prices to fall, they stop spending. As such, consumption falls and this puts downward pressure on aggregate demand. After all, if you think prices will be lower next week, then you are likely to wait until next week. This decision by consumers will cause aggregate demand to shift to the left, thus pushing national income down, creating higher unemployment. If this expectation continues, then so will the inward shifts in AD. This is the problem facing the eurozone. In November, the inflation rate fell to 0.3%. One of the key causes is falling energy prices – normally good news, but not if inflation is already too low.
 Jonathan Loynes, Chief European Economist at Capital Economics said:
“[the inflation and jobless data] gives the ECB yet another nudge to take urgent further action to revive the recovery and tackle the threat of deflation…We now expect the headline inflation rate to drop below zero at least briefly over the next six months and there is a clear danger of a more prolonged bout of falling prices.”
Some may see the lower prices as a positive change, with less household income being needed to buy the same basket of goods. However, the key question will be whether such low prices are seen as a temporary change or an indication of a longer-term trend. The answer to the question will have a significant effect on business decisions about investment and on the next steps to be taken by the ECB. It also has big consequences for other countries, in particular the UK. The data over the coming months across a range of macroeconomic variables may tell us a lot about what is to come throughout 2015. The following articles consider the eurozone data.
Euro area annual inflation down to 0.3% EuroStat News Release (28/11/14)
Eurozone inflation weakens again, adding pressure on ECB Nasdaq, Brian Blackstone (28/11/14)
Eurozone inflation rate falls in October BBC News (28/11/14)
Eurozone recovery fears weigh on UK plc, says report Financial Times, Alison Smith (30/11/14)
€300bn Jean-Claude Juncker Eurozone kickstarter sounds too good to be true The Guardian, Larry Elliott (26/11/14)
Eurozone area may be in ‘persistent stagnation trap’ says OECD BBC News (25/11/14)
Euro area ‘major risk to world growth’: OECD CNBC, Katy Barnato (25/11/14)
OECD sees gradual world recovery, urges ECB to do more Reuters, Ingrid Melander (25/11/14)
Questions
- What is deflation and why is it such a concern?
- Illustrate the impact of falling consumer demand in an AD/AS diagram.
- What policies are available to the ECB to tackle the problem of deflation? How successful are they likely to be and which factors will determine this?
- To what extent is the economic stagnation in the Eurozone a cause for concern to countries such as the UK and US? Explain your answer.
- How effective would quantitative easing be in combating the problem of deflation?
 The articles linked below look at the dangers of deflation and policies of central banks to counter it.
Deflation in economics has three meanings. The first is falling prices: i.e. negative inflation. The second, more traditional meaning, is a fall in real aggregate demand, resulting in lower output, higher unemployment and lower inflation – and quite possibly an actual fall in the price level. These first two definitions describe what is generally seen as an undesirable situation. The third is a slowing down in the growth of real aggregate demand, perhaps as a result of a deliberate act of fiscal and/or monetary policy. This third meaning could describe a desirable situation, where unsustainable growth is reduced and inflation is reduced from an above-target level.
Here we focus on the first definition. The first two articles look at the dangers of a fall in the price level. The chart below shows falling inflation, although not actually deflation, in China, France, Germany and the UK (click here for a PowerPoint). Several European countries, however, are experiencing actual deflation. These include: Greece, Spain, Hungary, Poland and Sweden. Inflation in the eurozone for 2014 is expected to be a mere 0.5%.
The most obvious danger of deflation (or expected deflation) is that people will delay spending on durable goods, such as cars, furniture and equipment, hoping to buy the items cheaper later. 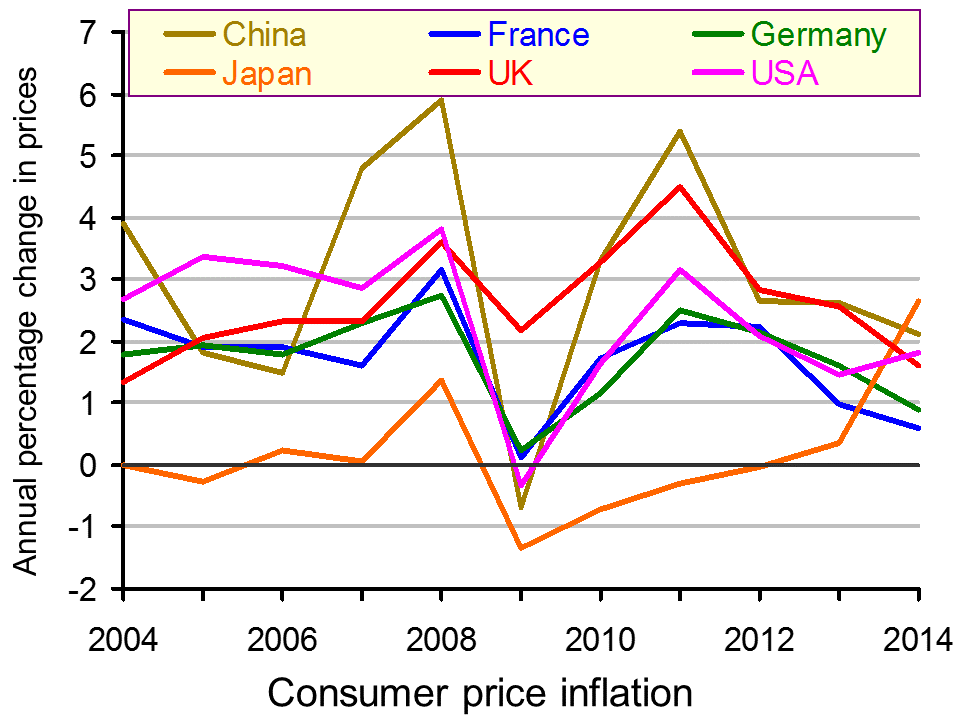 The result could be a fall in aggregate demand and a fall in output and employment.
For retailers, this is all spelling Christmas doom. Already the runup to the most crucial time of the year for shops is being characterised by a game of chicken. Shoppers are wondering how long they can leave their festive buying in the hope of late bargains.
Interest rates may be low, but for people with debts, this is being offset by the fact that inflation is no longer reducing the real value of that debt. For people with credit card debt, personal loans and most mortgages, the interest rate they pay is significantly above the rate of inflation. In other words, the real interest rate on their debt is still significantly positive. This may well discourage people from borrowing and spending, further dampening aggregate demand. And, with a Bank Rate of just 0.5%, there is virtually no scope for lowering the official interest rate further.
At least in the UK, economic growth is now positive – for the time being at any rate. The danger is becoming more serious, however, in many eurozone countries, which are already back in recession or close to being so. The ECB, despite its tentative steps to ease credit conditions, it moving closer to the day when it announces full-blown quantitative easing and buys sovereign bonds of eurozone countries. The Bank of Japan has already announced that it is stepping up it QE programme – a vital ingredient in getting Abenomics back on track and pulling Japan out of its latest recession.
In the USA, by contrast, there is little danger of deflation, as the US economy continues to grow strongly. The downside of this, has been a large rise in consumer debt (but not mortgages) – the ingredients of a possible future bubble and even a new financial crisis.
Forget what central bankers say: deflation is the real monster The Observer, Katie Allen (23/11/14)
Why Deflation Is Such A Big Worry For Europe NPR, Jim Zarroli (31/10/14)
Exclusive: China ready to cut rates again on fears of deflation – sources Reuters, Kevin Yao (23/11/14)
Central Banks in New Push to Prime Pump Wall Street Journal Jon Hilsenrath, Brian Blackstone and Lingling Wei (21/11/14)
Are Central Banks Panicking? Seeking Alpha, Leo Kolivakis (21/11/14)
Questions
- What are (a) the desirable and (b) the undesirable consequences of deflation? Does the answer depend on how deflation is defined?
- What is meant by a ‘deflationary gap’? In what sense is ‘deflationary’ being used in this term?
- Why have oil prices been falling? How desirable are these falls for the global economy?
- Is there an optimal rate of inflation? If so, how would this rate be determined?
- The chart shows that inflation in Japan is likely to have risen in 2014. This in large part is the result to a rise in the sales tax earlier this year. If there is no further rise in the sales tax, which there will probably not be if Mr Abe’s party wins the recently called election, what is likely to be the effect of the 2014 tax rise on inflation in 2015?
- If the Bank Rate is below the rate of inflation, why are people facing a positive real rate of interest? Does this apply equally to borrowers and savers?
- In what sense is there a cultural revolution at the Bank of England?
 So, while it’s not certain that the QE policy will be used, it seems pretty likely, especially as this policy has been floating around for almost a year.