 The latest Bank of England’s Money and Credit release shows net lending (lending net of repayments) by Monetary Financial Institutions (MFIs) to individuals in February was £4.9 billion. Although down on the £5.4 billion in January, it nonetheless means that over the last 12 months the flow of net lending amounted to £52.8 billion. This is the highest 12-month figure since October 2008.
The latest credit data raise concerns about levels of lending and their potential to again impact on the financial well-being of individuals, particularly in light of the falling proportion of income that households are saving. As we saw in UK growth fuelled by consumption as households again lose affection for their piggy banks the saving ratio fell to an historic low of 4.2 per cent for 2015.
An important factor affecting the financial well-being of individuals and households is the extent of their indebtedness. Flows of credit accumulate to become stocks of debt. Stocks of debt affect the extent to which household incomes becomes prey to debt servicing costs. Put simply, more and more income, all other things being equal, is needed for interest payments and capital repayments as debt stocks rise. Rising stocks of debt can also affect the ability of people to further fund borrowing, particularly if debt levels grow more quickly than asset values, such as the value of financial assets accumulated through saving. Consequently, the growth of debt can result in households incurring what is called balance sheet congestion with deteriorating financial well-being or increased financial stretch.
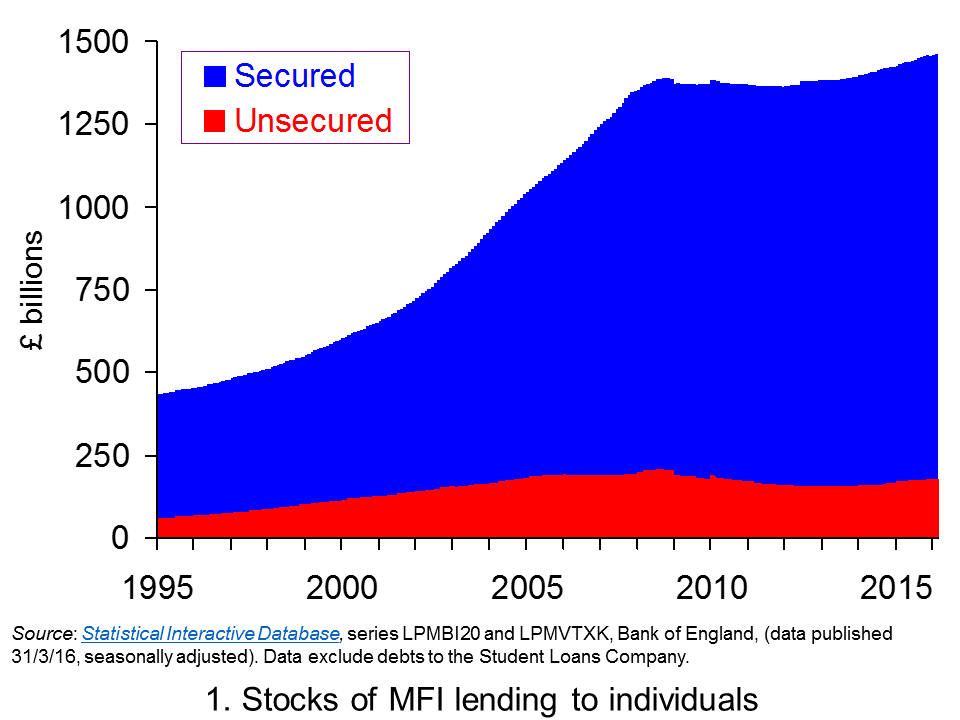 Chart 1 shows the stocks of debt acquired by individuals from MFIs, i.e. deposit-taking financial institutions. It shows both secured debt stocks (mortgage debt) and unsecured debt stocks (consumer credit). The scale of debt accumulation, particularly from the mid 1990s up to the financial crisis of the late 2000s is stark.
At the start of 1995 UK individuals had debts to MFIs of a little over £430 billion, the equivalent of roughly 55 per cent of annual GDP (Gross Domestic Product). By the autumn of 2008 this had hit £1.39 trillion, the equivalent of roughly 90 per cent of annual GDP. At both points around 85 per cent of the debt was secured debt, though around the start of the decade it had fallen back a little to around 80 per cent. (Click here to download a PowerPoint of Chart 1.)
The path of debt at the start of the 2010s is consistent with a story of consolidation. Both financially-distressed individuals and MFIs took steps to repair their balance sheets following the financial crisis. These steps, it is argued, are what resulted in a balance sheet recession. This saw the demand for and supply of additional credit wane. Consequently, as Chart 1 shows debt accumulation largely ceased.
More recently the indebtedness to MFIs of individuals has started to rise again. At the end of February 2014 the stock of debt was just shy of £1.4 trillion. By the end of February 2016 it had risen to £1.47 trillion (a little under 80 per cent of annual GDP). This is an increase of 4.7 per cent. Interestingly, the rise was largely driven by unsecured debt. It rose by 13.4 per cent from £159.4 billion to £180.7 billion. Despite the renewed buoyancy of the housing market, particularly in South East England, the stock of secured debt has risen by just 3.6 per cent from £1.24 trillion to £1.28 trillion.
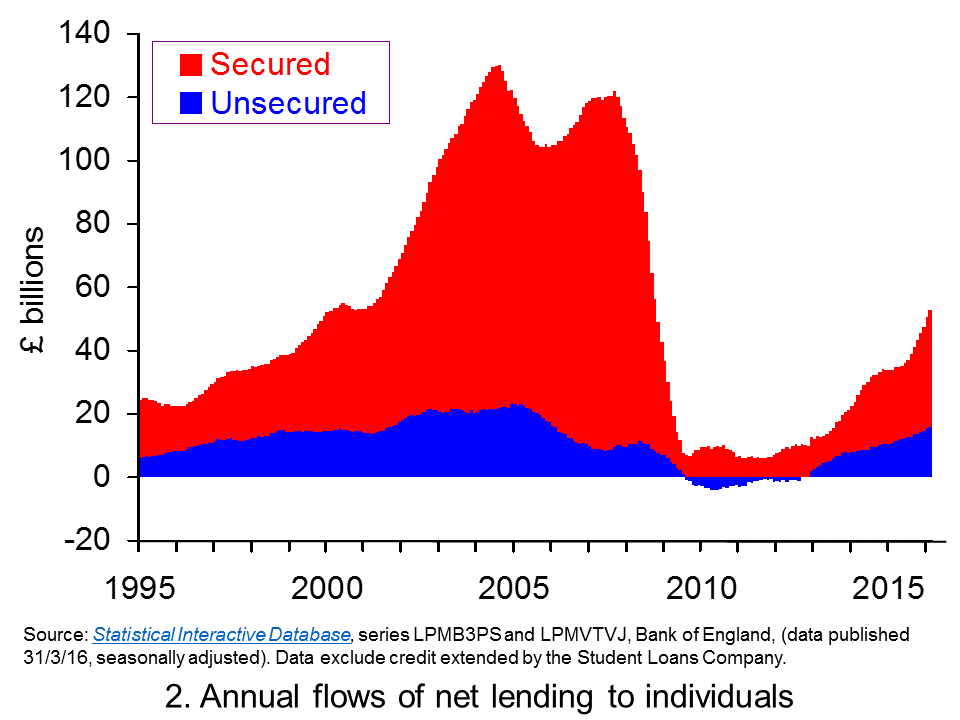 Chart 2 shows the annual flow of lending extended to individuals, net of repayments. (Click here to download a PowerPoint of Chart 2.) The chart provides evidence of cycles both in secured lending and in consumer credit (unsecured lending).
The growth in net lending during the 2000s was stark as was the subsequent squeeze on lending that followed. During 2004, for example, annual net flows of lending from MFIs to individuals exceeded £130 billion, the equivalent of close on 10.5 per cent of annual GDP. Secured lending was buoyed by strong house price growth with UK house price inflation rising above 14 per cent. Nonetheless, consumer credit was very strong too equivalent to 1.8 per cent of GDP.
Net lending collapsed following the financial crisis. In the 12 months to March 2011 the flow of net lending amounted to just £3.56 billion, a mere 0.2 per cent of annual GDP. Furthermore, net consumer credit was now negative. In other words, repayments were exceeding new sums being extended by MFIs.
Clearly, as Chart 2 shows, we can see that net lending to individuals is again on the rise. As we noted earlier, part of this this reflects a rebound in parts of the UK housing market. It is perhaps worth noting that secured lending helps individuals to purchase housing and thereby acquire physical wealth. While secured lending can find its way to fuelling spending, for example, through the purchase of goods and services when people move into a new home, consumer credit more directly fuels spending and so aggregate demand. Furthermore, consumer credit is not matched on the balance sheets by an asset in the same way that secured credit is.
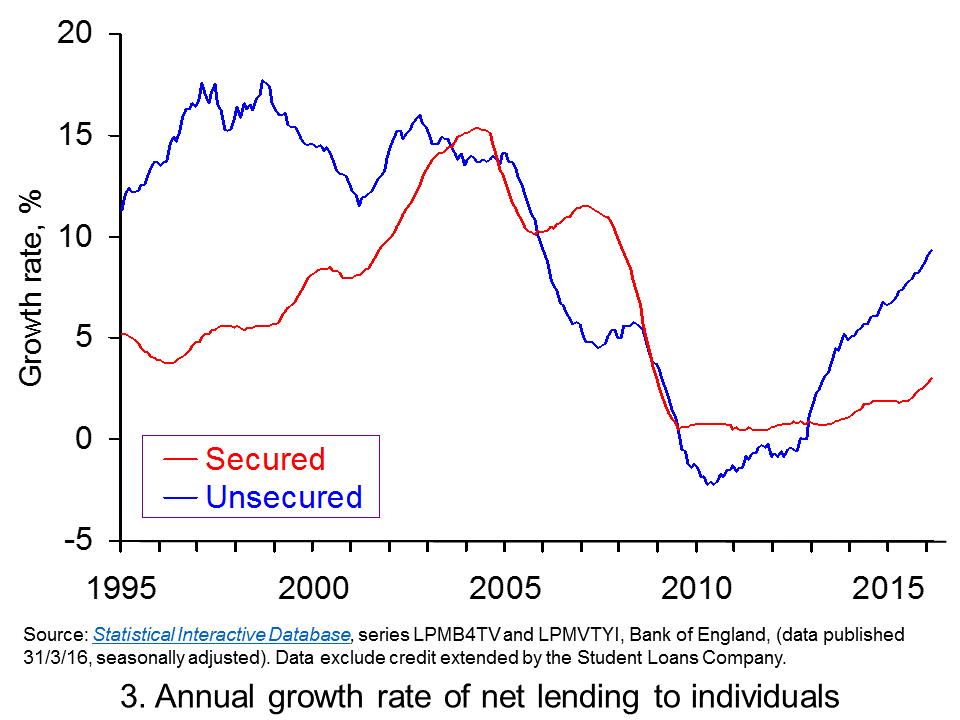 Chart 3 shows the annual growth rate of both forms of net lending by MFIs. In essence, this mirrors the growth rate in the stocks of debt though changes in the stocks of debt can also be affected by the writing off of debts. What the chart nicely shows is the strong rates of growth in net unsecured lending from MFIs. In fact, it is the strongest annual rate of growth since January 2006 (Click here to download a PowerPoint of the chart.)
The growth in consumer credit, the fall in the saving ratio and the growth in consumer spending point to a need for individuals to be mindful of their financial well-being. What is for sure, is that you can expect to see considerable comment in the months ahead about consumption, credit and income data. Fundamental to these discussions will be the sustainability of current lending patterns.
Articles
Consumer Lending Growth Highest Since 2005 Sky News, (31/3/16)
Britons raid savings to fund spending as economists warn recovery ‘built on sand’ Telegraph, Szu Ping Chan (31/3/16)
Household debt binge has no end in sight, says OBR Telegraph, Szu Ping Chan (17/3/16)
Surge in borrowing… as savings dwindle: Household savings are at an all-time low as families turn to cheap loans and credit cards Daily Mail, James Burton (1/4/16)
George Osborne banks on household debt time bomb to meet his Budget targets Mirror, Ben Glaze (29/3/16)
Britain’s free market economy isn’t working Guardian (13/1/16)
Data
Bankstats (Monetary and Financial Statistics) – Latest Tables Bank of England
Statistical Interactive Database Bank of England
Questions
- What does it mean if individuals are financially distressed?
- How would we measure the financial well-being of individuals and households?
- What actions might individuals take it they are financially distressed? What might the economic consequences be?
- How might uncertainty affect spending and saving by households?
- What measures can policymakers take to reduce the likelihood that flows of credit become too excessive?
- What is meant by a balance sheet recession?
- Explain the difference between secured debt and unsecured debt.
- Should we be more concerned about the growth of consumer credit than secured debt?
 Project Syndicate is an organisation which produces articles on a range of economic, political and social topics written by eminent scholars, political and business leaders, policymakers and civic activists. It then makes these available to news media in more than 150 countries. Here we look at four such articles which assess the outlook for the European and global economies and even that of capitalism itself.
The general tone is one of pessimism. Despite unconventional monetary policies, such as quantitative easing (QE) and negative nominal interest rates, the global recovery is anaemic. As the Nouriel Roubini articles states:
Unconventional monetary policies – entrenched now for almost a decade – have themselves become conventional. And, in view of persistent lacklustre growth and deflation risk in most advanced economies, monetary policymakers will have to continue their lonely fight with a new set of ‘unconventional unconventional’ monetary policies.
Perhaps this will involve supplying additional money directly to consumers and/or business in a so-called ‘helicopter drop’ of money. Perhaps it will be supplying money directly to governments to finance infrastructure projects – a policy dubbed ‘people’s quantitative easing‘. Perhaps it will involve taxing the holding of cash by banks to encourage them to lend.
 The Hans-Werner Sinn article looks at some of the consequences of the huge amount of money created through QE and continuing to be created in the eurozone. Although it has not boosted consumption and investment nearly as much as desired, it has caused bubbles in various asset markets. For example, the property market has soared in many countries:
Property markets in Austria, Germany, and Luxembourg have practically exploded throughout the crisis, as a result of banks chasing borrowers with offers of loans at near-zero interest rates, regardless of their creditworthiness.
The German property boom could be reined in with an appropriate jump in interest rates. But, given the ECB’s apparent determination to head in the opposite direction, the bubble will only grow. If it bursts, the effects could be dire for the euro.
The Jean Pisani-Ferry article widens the analysis of the eurozone’s problems. Like Roubini, he considers the possibility of a helicopter drop of money, which “would be functionally equivalent to a direct government transfer to households, financed by central banks’ permanent issuance of money”.
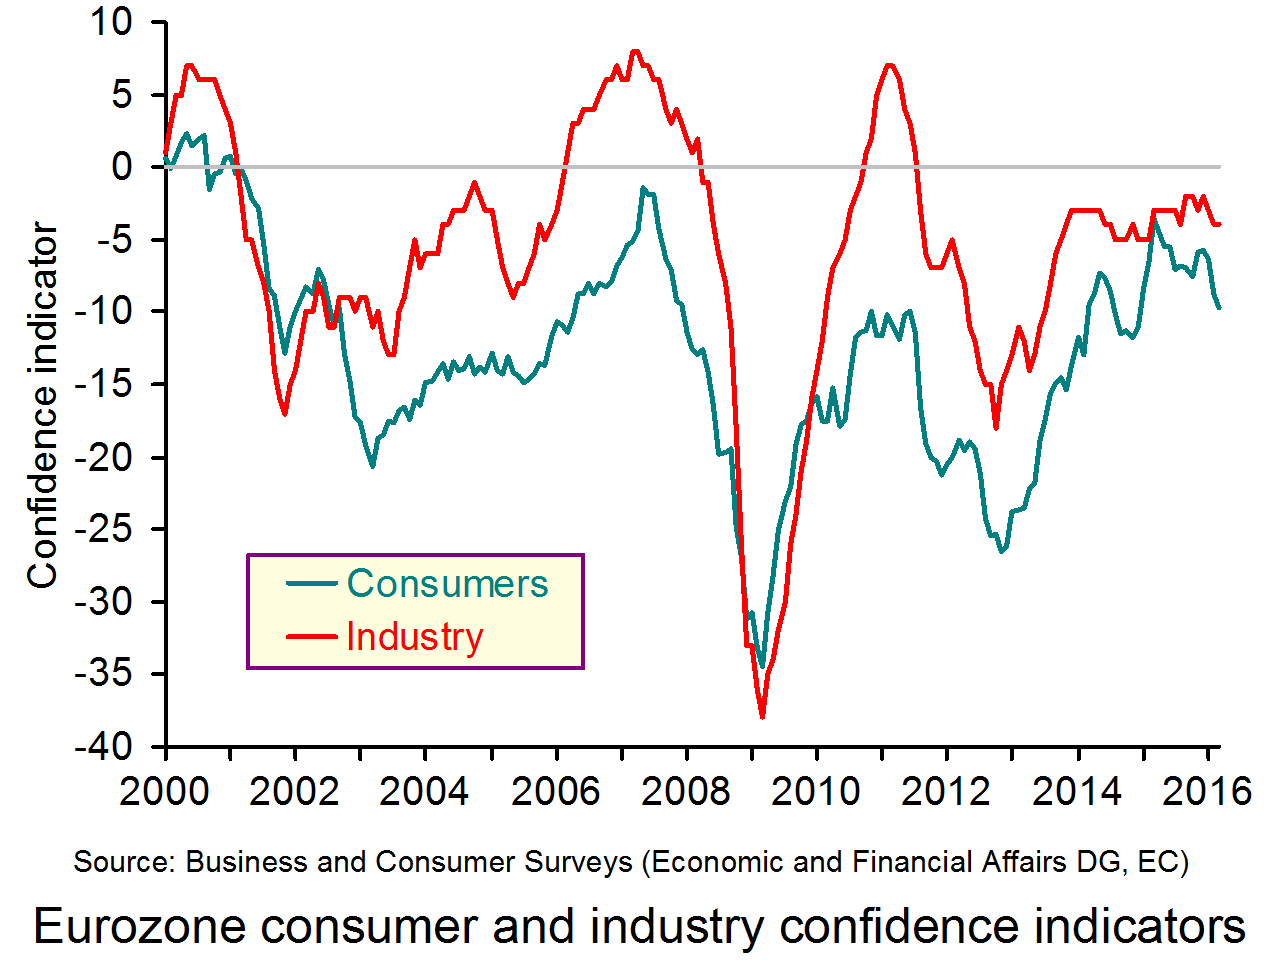 Without such drastic measures he sees consumer and business pessimism (see chart) undermining recovery and making the eurozone vulnerable to global shocks, such as further weakening in China. (Click here for a PowerPoint of the chart.)
Finally, Anatole Kaletsky takes a broad historical view. He starts by saying that “All over the world today, there is a sense of the end of an era, a deep foreboding about the disintegration of previously stable societies.” He argues that the era of ‘leaving things to the market’ is coming to an end. This was an era inspired by the monetarist and supply-side revolutions of the 1960s and 1970s that led to the privatisation and deregulation policies of Reagan, Thatcher and other world leaders.
But if the market cannot cope with the complexities of today’s world, neither can governments.
If the world is too complex and unpredictable for either markets or governments to achieve social objectives, then new systems of checks and balances must be designed so that political decision-making can constrain economic incentives and vice versa. If the world is characterized by ambiguity and unpredictability, then the economic theories of the pre-crisis period – rational expectations, efficient markets, and the neutrality of money – must be revised.
… It is obvious that new technology and the integration of billions of additional workers into global markets have created opportunities that should mean greater prosperity in the decades ahead than before the crisis. Yet ‘responsible’ politicians everywhere warn citizens about a ‘new normal’ of stagnant growth. No wonder voters are up in arms.
His solution has much in common with that of Roubini and Pisani-Ferry. “Money could be printed and distributed directly to citizens. Minimum wages could be raised to reduce inequality. Governments could invest much more in infrastructure and innovation at zero cost. Bank regulation could encourage lending, instead of restricting it.”
So will there be a new era of even more unconventional monetary policy and greater regulation that encourages rather than restricts investment? Read the articles and try answering the questions.
Articles
Unconventional Monetary Policy on Stilts Project Syndicate, Nouriel Roubini (1/4/16)
Europe’s Emerging Bubbles Project Syndicate, Hans-Werner Sinn (28/3/16)
Preparing for Europe’s Next Recession Project Syndicate, Jean Pisani-Ferry (31/3/16)
When Things Fall Apart Project Syndicate, Anatole Kaletsky (31/3/16)
Questions
- Explain how a ‘helicopter drop’ of money would work in practice.
- Why has growth in the eurozone been so anaemic since the recession of 2009/10?
- What is the relationship between tightening the regulations about capital and liquidity requirements of banks and bank lending?
- Explain the policies of the different eras identified by Anatole Kaletsky.
- Would it be fair to describe the proposals for more unconventional monetary policies as ‘Keynesian’?
- If quantitative easing was used to finance government infrastructure investment, what would be the effect on the public-sector deficit and debt?
- If the inflation of asset prices is a bubble, what could cause the bubble to burst and what would be the effect on the wider economy?
 The latest data in the Quarterly National Accounts show that UK households in 2015 spent £1.152 trillion, the equivalent of 62 per cent of the country’s Gross Domestic Product (GDP). In real terms, household spending rose by 2.8 per cent in 2015 in excess of the 2.3 per cent growth observed in GDP. In the final quarter of 2015 real household spending rose by 0.6 per – the same rate of growth as that recorded for the UK economy. This was the tenth consecutive quarter of positive consumption growth and the twelfth of economic growth.
It is the consistent growth seen over the recent past in real household spending that marks it out from the other components of aggregate demand. Consequently, household spending remains the bedrock of UK growth.
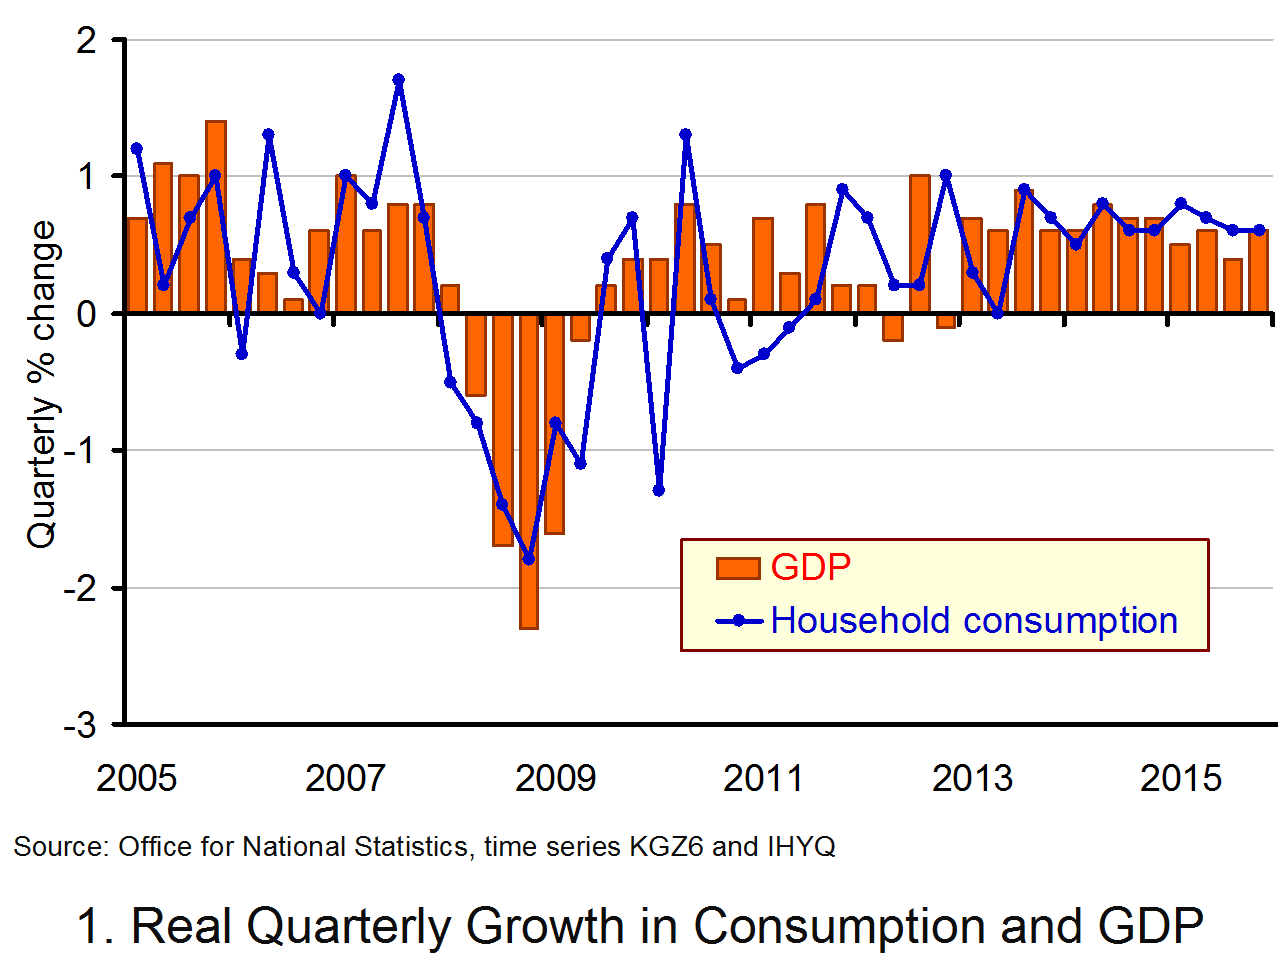 Chart 1 helps to evidence the close relationship between consumption and economic growth. It picks out nicely the stark turnaround both in economic growth and consumer spending following the financial crisis. Over the period from 2008 Q1 to 2011 Q2, real consumer spending typically fell by 0.4 per cent each quarter. This weakness in consumption was mirrored by economic growth. Real GDP contracted over this period by an average of 0.2 per cent each quarter. (Click here to download a PowerPoint of the chart.)
Since 2011 Q3 real consumption growth has averaged 0.6 per cent per quarter – the rate at which consumption grew in 2015 Q4 – while, real GDP growth has averaged 0.5 per cent per quarter. Over this same period the real disposable income (post-tax income) of the combined household and NPISH (non-profit institutions serving households), has typically grown by 0.4 per cent per quarter. (NPISHs are charities and voluntary organisations.)
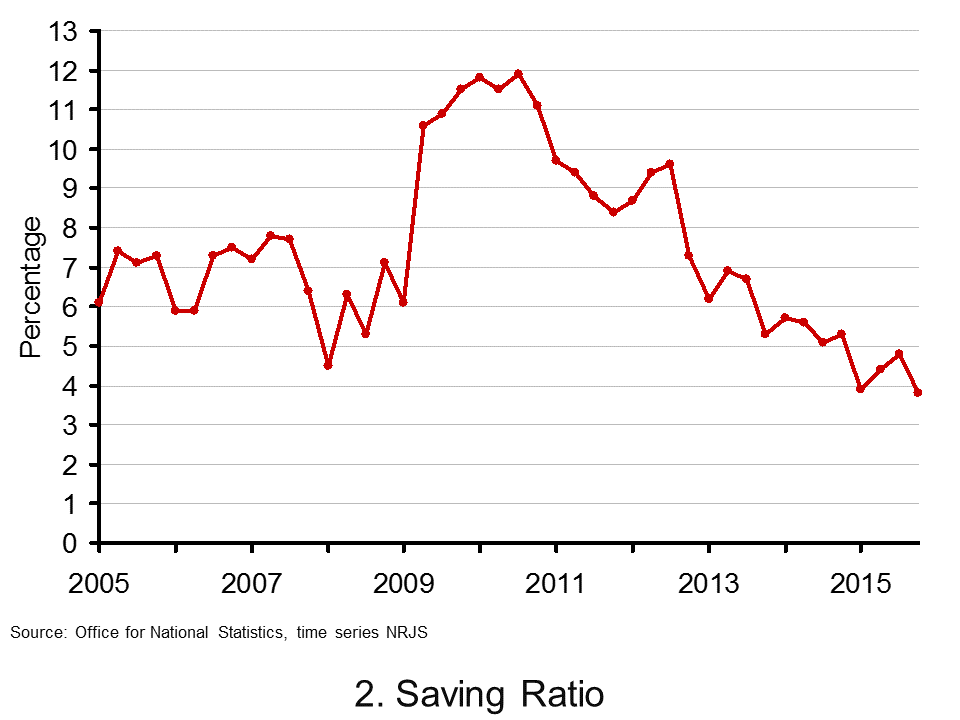 The strength of consumption relative to income is evidenced by the decline in the saving ratio as can be observed in Chart 2. The ratio captures the percentage of disposable income that households (and NPISHs) choose to save. In 2010 Q3 the proportion of income saved hit 11.9 per cent having been as low as 4.5 per cent in 2008 Q1. By 2015 Q4 the saving ratio had fallen to 3.8 per cent, the lowest value since the series began in 1963 Q1. (Click here to download a PowerPoint.)
The historic low in the saving ratio in the final quarter of 2015 reflects the strength of consumption alongside a sharp fall in real disposable income of 0.6 per cent in the quarter. However, the bigger picture shows a marked downward trend in the saving ratio over the period from 2012.
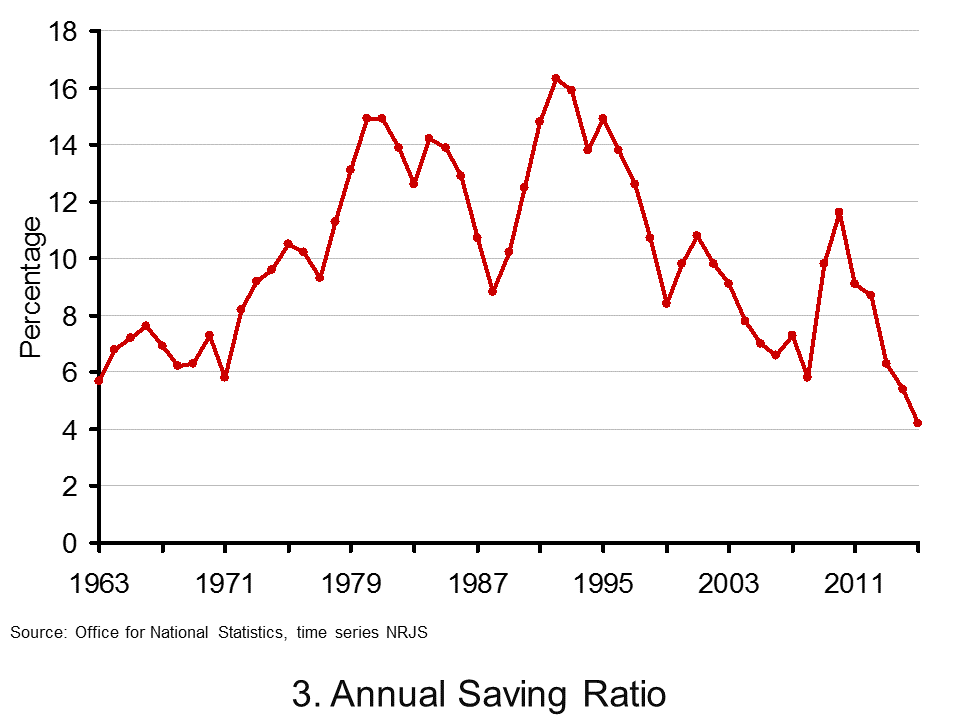 When seen in a more historic context the latest numbers taken on even greater significance. Chart 3 shows the annual saving ratio since 1963. From it we can see that the 2015 value of 4.2 was the first year when the ratio fell below 5 per cent. With 2014 being the previous historic low, there must be some concern that UK consumption growth is not being underpinned by income growth. (Click here to download a PowerPoint.)
 Of course, consumption theory places great emphasis on expected future income in determining current spending. To some extent it may be argued that households were liquidity-constrained following the financial crisis. They were unable to borrow to support spending and, as time moved on, to borrow against the expectation of stronger income growth in the future. This would have depressed consumption growth. But, there may also have been a self-imposed liquidity constraint as the financial crisis unfolded. Heightened uncertainty may have led households to be more prudent and divert resources to saving. Such precautionary saving would tend to boost the saving ratio and so may be a factor in the sharp rise we observed in the ratio.
 The easing of credit constraints as we headed through the early 2010s allied with stronger economic growth may help to explain the strength of the recovery in consumption growth. However, it is the extent and, in particular, the duration of this strong consumption growth that is fuelling a debate over its sustainability. The current uncertainty around future income growth and the need for households to be mindful of the indebtedness built up prior to the financial crisis point to households needing to retain a degree of caution. Consequently, the debates around the financial well-being of households and the need to rebalance the UK economy away from consumer spending are likely to be further intensified by the latest consumption and saving data.
Data
All data related to Quarterly National Accounts: Quarter 4 (Oct to Dec) 2015 Office for National Statistics
Office for National Statistics Office for National Statistics
Articles
Britons raid savings to fund spending as economists warn recovery ‘built on sand’ Telegraph, Szu Ping Chan (31/3/16)
UK Growth Higher But Deficit Hits New Record Sky News, (31/3/16)
Britain is a nation that has forgotten how to save Telegraph, Jeremy Warner (31/3/16)
A vulnerable economy: the true cost of Britain’s current account deficit Guardian, Larry Elliott (31/3/16)
U.K. Manufacturing ‘In the Doldrums’ Leaves Growth Lopsided Bloomberg, Emma Charlton (1/4/16)
Pound drops as UK manufacturing languishes in the doldrums Telegraph, Szu Ping Chan (1/4/16)
Questions
- Why is the distinction between nominal and real growth an important one when looking at many macroeconomic variables.
- Examine the argument that the historic low saving ratio in the UK is a cause for concern.
- What factors might we expect to impact on the saving ratio?
- To what extent do you think the current growth in consumer spending is sustainable?
- How important are expectations in determining consumer behaviour?
- Explain what you understand by consumption smoothing.
- Why would we would typically expect consumption growth to be less variable than that in disposable income?
- Why might consumption sometimes be observed to be less sensitive or more sensitive to income changes?
- What factors might cause households to be liquidity constrained?
- What is precautionary saving? What might affect its perceived importance among households?
 It doesn’t seem long ago that we were looking at the prospects of Brazil for hosting the Football World Cup. Now, we turn to the same economy, but this time for the Olympics. It is often the case that hosting big global sporting events can give a boost to the host nation, but is Brazil prepared for it? Did the World Cup bring the expected economic boosts? Some argue that the Olympics is just what Brazil needs, but others suggest it will only worsen the economic situation in the world’s seventh largest economy.
Brazil’s economic performance in the past year was not good. In fact, it was one of the worst performing nations of any major economy, with GDP falling by 3%. This is a very different country from the one that was awarded this biggest of sporting events. Despite these difficult times, Brazil’s government maintains that the country is ready and that the games will be ‘spectacular’.
Key to hosting a sporting event such as the Olympics is the infrastructure investment and as a key component of aggregate demand, this should be a stimulant for growth and job creation. However, with the economy still struggling, many are concerned that the infrastructure won’t be in place in time.
Other benefits from this should be the boost to growth driven by athletes and spectators coming from around the globe, buying tickets, memorabilia, accommodation, food and other items that tourists tend to buy. A multiplier effect should be seen and according to research has the potential to create significant benefits for the whole economy and not just the local regions where events take place. You can look at similar analysis in blogs written about Tokyo: 2020 Tokyo Olympics and London: The London Olympics legacy: a cost–benefit analysis and Does hosting the Olympics Games increase economic growth?
But, is this really likely to happen, especially given the somewhat lacklustre boost that the Brazil World Cup gave to the economy? The following articles consider this.
Rio 2016: Can Games bounce back from Brazil economic woes? BBC News, Bill Wilson (11/03/16)
Does hosting the Olympics actually pay off? It’s the economy, Binyamin Applebaum (5/08/14)
Rio Olympics no help to Brazil economy based on World Cup Bloomberg, Raymond Colitt (16/01/15)
The economic impact of Brazil’s 2014 World Cup and 2016 Olympics Saxo Group, Trading Floor, Sverrir Sverrisson (27/08/12)
Special Interview: Cost–benefit analysis of hosting the World Cup, Olympics Al Arabiya, Ricardo Guerra (3/7/14)
Questions
- How might you carry out a cost–benefit analysis to decide whether to host a big sporting event?
- Are there any externalities that might result from hosting the Olympics? How easy is it to estimate their monetary value? Should this be taken into account by a country when making a decision?
- Why might there be a boost to aggregate demand prior to the Olympics?
- Why might there be a multiplier effect when a nation hosts the Olympics or another sporting event?
- Might there be benefits to Brazil’s neighbours from its hosting the Olympics?
 Deflation is currently a concern in the UK and across Europe. However, relative to Japan, the deflation concern is small. In Japan, deflation has been problematic for more than two decades and this has had significant implications for the Japanese economy.
‘Abenomics’ has been in practice in Japan, as the Prime Minister, Shinzo Abe, has been trying to reflate the economy. Growth has been improving and the deflation concern appeared to be under control. However, GDP data now shows that the economy is once again declining and so with aggregate demand falling, this pushes down average prices across the economy and so the deflation risk re-emerges. This article from BBC News and another from The Guardian look at the economic policy known as ‘Abenomics’ and how the Japanese economy is faring.
Articles
Off target: Is it the end of ‘Abenomics’ in Japan? BBC News, Rupert Wingfield-Hayes (15/2/16)
Japan’s economy shrinks again as Abenomics is blown off course The Guardian, Justin McCurry (15/2/16)
Previous blogs
Japan’s deflation fears grow (update) (27/2/16)
Riding the Japanese roller coaster (15/2/16)
Japan’s interesting monetary stance as deflation fears grow (14/2/16)
Japan’s arrows missing their target (17/11/14)
Japan’s recovery (3/2/14)
Abenomics – one year on (16/12/13)
Japan’s three arrows (6/6/13)
Questions
- What are the key features of Japan’s ‘Abenomics’?
- Why is deflation such a concern? Surely falling prices are good for consumers and hence the economy.
- How has Japan been trying to reflate its economy and why has this failed?
- The yen is getting stronger, but how will this affect the Japanese economy? Use a demand and supply diagram to illustrate what has caused the value of the yen to fall and an aggregate demand and supply diagram to show the impact.
- Negative interest rates have been implemented in Japan. What does this mean for savers and borrowers and the economy?
- How do you think Japan’s stance on immigration and structural change is affecting its macroeconomy?