 In a post last August we looked at the rising number of workers employed on ‘zero-hours’ contracts. These are contracts where there are no guaranteed minimum hours. Such contracts give employers the flexibility to employ workers as much or as little as suits the business. Sometimes it benefits workers, who might be given the flexibility to request the hours that suit them, but usually workers simply have to take the hours on offer.
Latest figures published by the Office for National Statistics show that zero-hours contracts are on the increase. In 2014 quarter 4, 697,000 workers were recorded as being on zero-hours contracts. 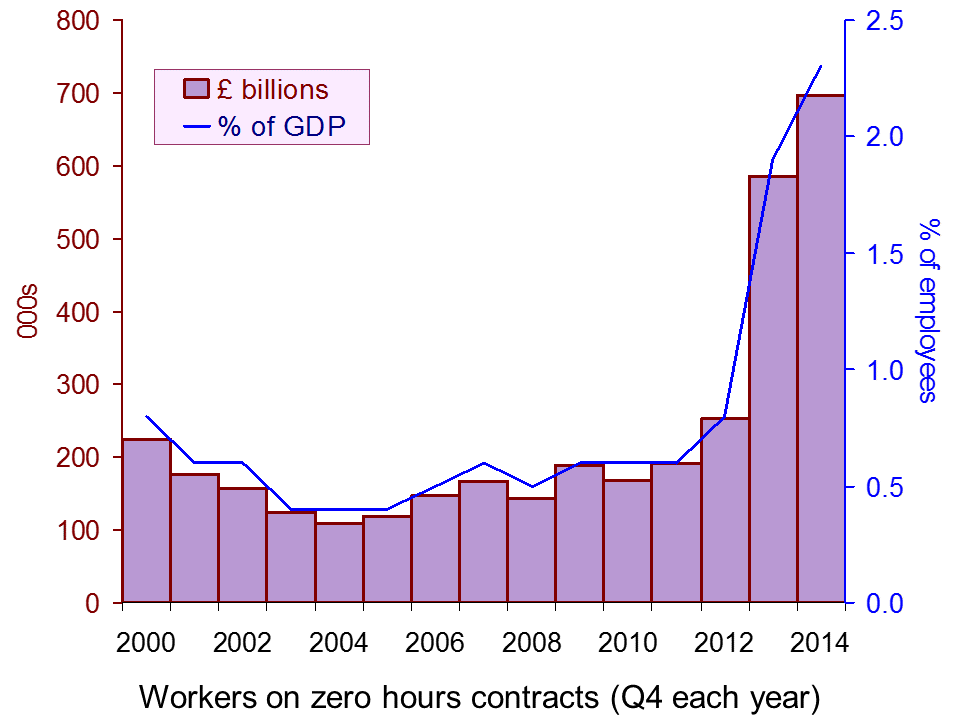 This represents 2.3% of people in employment. Ten years ago (2004, Q4) the figures were 108,000 or 0.4%: see chart. (Click here for a PowerPoint of the chart.)
Around one third of the 697,000 people on zero-hours contracts wanted more work if they could get it and most wanted it in their current job rather than having to move jobs. These people wanting more work can be classed as underemployed. They also include those not on a zero-hours contract who would like to work more if they could.
According to the ONS:
‘People on zero-hours contracts are more likely to be women, in full-time education or in young or older age groups when compared with other people in employment. On average, someone on a zero-hours contract usually works 25 hours a week.’ (See section 4 of the report for more details.)
As we saw in the earlier post, many public- and private-sector employers use such contracts, including many small and medium-sized enterprises and many well-known large companies, such as Sports Direct, Amazon, JD Wetherspoon and Cineworld. It gives them the flexibility to adjust the hours they employ people. It allows them to keep people in employment when demand is low. It also makes them more willing to take on staff when demand rises, as it removes the fear of being over-staffed if demand then falls back.
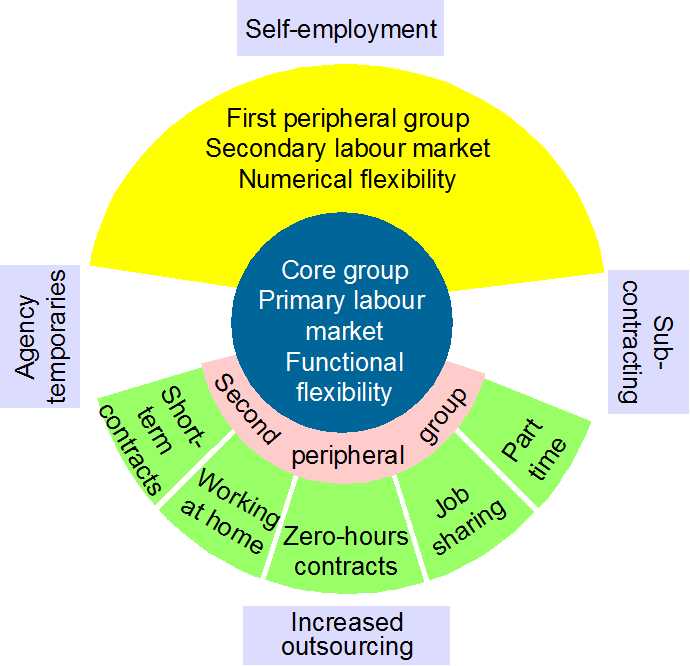 As we also saw, zero-hours contracts are not the only form of flexible working. Other examples include: ‘self-employed’ workers, contracted separately for each job they do for a company; people paid largely or wholly on commission; on-call working; part-time working, where the hours are specified in advance, but where these are periodically re-negotiated; overtime; people producing a product or service for a company (perhaps at home), where the company varies the amount paid per unit according to market conditions.
The extent of zero-hours contracts varies dramatically from one sector of the economy to another. Only 0.6% of workers in the Information, Finance and Professional sectors were on zero-hours contracts in 2014 Q4, whereas 10% in the Accommodation and Food sectors were.
The flexibility that such contracts give employers may make them more willing to keep on workers when demand is low – they can reduce workers’ hours rather than laying them off. It also may make them more willing to take on workers (or increase their hours) when demand is expanding, not having to worry about being over staffed later on.
However, many workers on such contracts find it hard to budget when their hours are not guaranteed and can vary significantly from week to week.
Articles
lmost 700,000 people in UK have zero-hours contract as main job The Guardian, Phillip Inman (25/2/15)
UK firms use 1.8m zero-hours contracts, says ONS BBC News (25/1/15)
Zero-hours contracts jump in UK Financial Times, Emily Cadman (25/2/15)
Zero-hours contracts ‘disturbingly’ hit 1.8 million in 2014 International Business Times, Ian Silvera (25/2/15)
Zero-hours contracts a reality for almost 700,000 UK workers, ONS figures show Independent, Antonia Molloy (25/1/15)
Data
Contracts with No Guaranteed Hours, Zero Hour Contracts, 2014 ONS Release (25/1/15)
Supplementary LFS data on zero hours contracts – October to December 2014 ONS dataset (25/2/15)
Analysis of Employee Contracts that do not Guarantee a Minimum Number of Hours ONS Report (25/1/15)
Questions
- Distinguish between open unemployment, disguised unemployment and underemployment?
- Distinguish between functional, numerical and financial flexibility? Which type or types of flexibility do zero-hours contracts give the firm?
- In a ‘flexible’ labour market, what forms can that flexibility take?
- Why does the Accommodation and Food sector have a relatively high proportion of people employed on zero-hours contracts?
- What are the benefits and costs to employers of using zero-hours contracts?
- If a company introduces a system of zero-hours contracts, is this in accordance with the marginal productivity theory of profit maximisation from employment?
- What are the benefits and costs to employees of working on zero-hours contracts?
- Why has the use of zero-hours contracts risen so rapidly?
- Using the ONS data, find out how the use of zero-hours contracts varies by occupation and explain why.
- Identify what forms of flexible contracts are used for staff in your university or educational establishment. Do they benefit (a) staff; (b) students?
- Consider the arguments for and against (a) banning and (b) regulating zero-hours contracts.
 Figures for employment and unemployment give an incomplete picture of the state of the labour market. Just because a person is employed, that does not mean that they are working the number of hours they would like.
Some people would like to work more hours, either by working more hours in their current job, or by switching to an alternative job with more hours or by taking on an additional part-time job. Such people are classed as ‘underemployed’. On average, underemployed workers wanted to work an additional 11.3 hours per week in 2014 Q2. Underemployment is a measure of slack in the labour market, but it is not picked up in the unemployment statistics.
Other people would like to work fewer hours (at the same hourly rate), but feel they have no choice – usually because their employer demands that they work long hours. Some, however, would like to change to another job with fewer hours even if it involved less pay. People willing to sacrifice pay in order to work fewer hours are classed as ‘overemployed’.
Statistics released by the Office for National Statistics show that, in April to June 2014, 9.9%, or 3.0 million, workers in the UK were underemployed; and 9.7%, or 2.9 million, were overemployed.
The figures for underemployment vary between different groups:
|
|
| • |
11.0% of female workers |
8.9% of male workers |
| • |
19.6% of 16-24 year olds |
9.9% of all workers |
| • |
21.1% of people in elementary occupations (e.g. cleaners, shop assistants and security guards) |
5.4% of people in professional occupations (e.g. doctors, teachers and accountants) |
| • |
11.5% of people in the North East of England (in 2013) |
9.2% of people in the East of England (in 2013) |
| • |
22.1% of part-time workers |
5.4% of full-time workers |
As far as the overemployed are concerned, professional people and older people are more likely want shorter hours
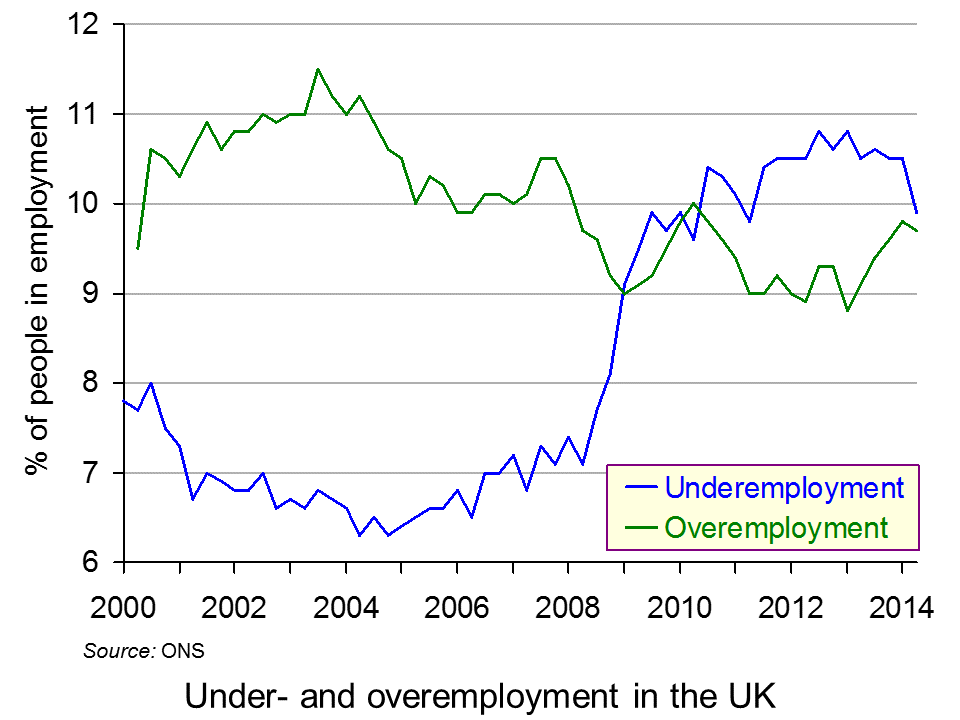 The ONS data also show how under- and overemployment have changed over time: see chart (click here for a PowerPoint). Before the financial crisis and recession, overemployment exceeded underemployment. After the crisis, the position reversed: underemployment rose from 6.8% in 2007 to a peak of 10.8% in mid-2012; while overemployment fell from 10.5% in 2007 to a trough of 8.8% in early 2013.
More recently, as the economy has grown more strongly, underemployment has fallen back to 9.9% (in 2014 Q2) and overemployment has risen to 9.7%, virtually closing the gap between the two.
The fact that there is still significant underemployment suggests that there is still considerable slack in the labour market and that this may be acting as a brake on wage increases. On the other hand, the large numbers of people who consider themselves overemployed, especially among the professions and older workers, suggests that many people feel that they have not got the right work–life balance and many may be suffering consequent high levels of stress.
Articles
Rise in number of UK workers who want to cut back hours, ONS says The Guardian, Phillip Inman (25/11/14)
Data reveal slack and stretch in UK workforce Financial Times, Sarah O’Connor (25/11/14)
Will you graduate into underemployment? The Guardian, Jade Grassby (30/9/14)
Three million people would take pay cut to work shorter hours: Number who say they feel overworked rises by 10 per cent in one year Mail Online, Louise Eccles (26/11/14)
ONS: Rate of under-employment in Scotland lower than UK average Daily Record, Scott McCulloch (25/11/14)
ONS Release
Underemployment and Overemployment in the UK, 2014 ONS (25/11/14)
Questions
- Distinguish between unemployment (labour force survey (LFS) measure), unemployment (claimant count measure), underemployment (UK measure), underemployment (Eurostat measure) and disguised unemployment.
- Why is underemployment much higher amongst part-time workers than full-time workers?
- How do (a) underemployment and (b) overemployment vary according to the type of occupation? What explanations are there for the differences?
- Is the percentage of underemployment a good indicator of the degree of slack in the economy? Explain.
- How is the rise in zero hours contracts likely to have affected underemployment?
- How could the problem of overemployment be tackled? Would it be a good idea to pass a law setting a maximum number of hours per week that people can be required to do in a job?
- Would flexible working rights be a good idea?
 Unemployment and employment are concepts that are often talked about in the media. Indeed, the 7% unemployment target referred to by the Governor of the Bank of England has been a constant feature of recent headlines. However, rather than targeting an unemployment rate of 7%, George Osborne has now called for ‘full employment’ and believes that tax and welfare changes are key to meeting this objective.
Reducing the unemployment rate is a key macroeconomic objective and the costs of unemployment are well-documented. There are obviously big costs to the individual and his/her family, including lower income, dependency, stress and potential health effects. There are also costs to the government: lower income tax revenues, potentially lower revenues from VAT through reduced consumer expenditure and the possibility of higher benefit payments. There are other more ‘economic’ costs, namely an inefficient use of resources. Unemployment represents a cost to the economy, as we are operating below full capacity and we therefore see a waste of resources. It is for this reason that ‘full employment’ is being targeted.
Traditional economic theory suggests that there is a trade-off between unemployment and inflation, illustrated by the well-known Phillips curve. In the past, governments have been willing to sacrifice unemployment for the purpose of reducing inflation. There have also been attempts to boost the economy and create jobs through increased borrowing. However, George Osborne has said:
Unemployment is never a price worth paying, but artificial jobs paid for with borrowed money doesn’t work either.
A figure representing full employment hasn’t been mentioned, so it remains unclear what level of unemployment would be acceptable, as despite the name ‘full employment’, this doesn’t mean that everyone has a job. There are several definitions of full employment, in both an economic and political context. In the period of reconstruction after the Second World War, William Beveridge, architect of the welfare state, defined full employment as where 3% of people would be unemployed.
In more recent times, other definitions have been given. In the era of monetarism in the 1970s, the term ‘natural rate of unemployment’ was used to define the unemployment rate to which economies tend in the long run – after inflationary expectations have adjusted. Keynesians use the term the ‘non-accelerating-inflation rate of unemployment (NAIRU)’, where unemployment is confined to equilibrium unemployment and where there is no excess or deficiency of aggregate demand. Both the natural rate and the NAIRU relate to the rate of unemployment at which the long-run Phillips curve is vertical.
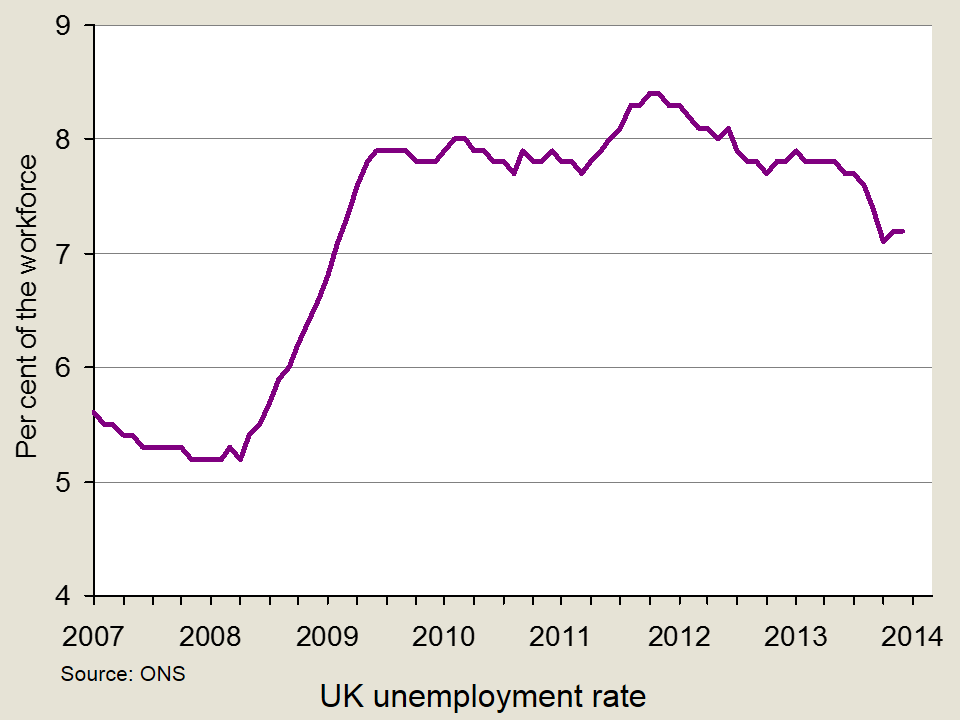
In its Economic and Fiscal Outlook of March 2013, the Office for Budget Responsibility estimated the UK’s NAIRU to be 5.4%. George Osborne has not specified a particular rate. Rather, his speech refers to creating the ‘highest employment rate of any of the world’s leading economies’. He said the ambition was to make the UK:
…the best place in the world to create a job; to get a job; to keep a job; to be helped to look for another job if you lose one…A modern approach to full employment means backing business. It means cutting the tax on jobs and reforming welfare.
Therefore, while it appears that there is no target figure for unemployment, it seems that a new Conservative objective will be to focus on sustainable job creation and eliminate disequilibrium unemployment. This represents a move very much into Labour territory. Meeting the objective will be no easy task, given the past few years and such high levels of youth unemployment, as Labour were quick to point out, but the unemployment figures are certainly moving in the right direction. The following articles consider the objective of full employment.
Articles
Britain’s Osborne changes tone on economy with “full employment” target Reuters, William James (31/3/14)
George Osborne commits to ‘fight for full employment’ BBC News (including video) (1/4/14)
What does full employment mean? The Guardian (1/4/14)
What is full employment? The Telegraph, Peter Dominiczak (31/3/14)
’Jobs matter’, says George Osborne as he aims for full employment Independent, Andrew Grice (31/3/14)
Liam Bynre: Labour would aim for ‘full employment’ BBC News (17/5/13)
Osborne pledges full employment for UK Sky News (31/3/14)
Osborne commits to full employment as election looms Bloomberg, Svenja O’Donnell (31/3/14)
Whatever happened to full employment? BBC News, Tom de Castella and Caroline McClatchey (13/10/11)
Questions
- What is meant by full employment?
- Is it a good idea to target zero unemployment?
- Using a diagram, illustrate the difference between disequilibrium and equilibrium unemployment?
- How can full employment be achieved?
- What are the costs of unemployment?
- Use a diagram to illustrate the natural rate of unemployment and explain what it means in terms of the relationship between unemployment and inflation.
 Conservative Party leaders are considering the benefits of an above-inflation rise in the minimum wage. This policy has been advocated by both the Labour Party and the Liberal Democrats as a means of helping the lowest paid workers. From 2008 to 2013, minimum wage rates fell 5.2% in real terms: in other words, nominal increases were less than the increase in both the RPI and CPI (see UK minimum wage: a history in numbers).
Advocates of a real rise in the minimum wage argue that not only would it help low-paid workers, many of whom are in severe financial difficulties, but it would benefit the Treasury. According to Policy Exchange, a free-market think tank closely aligned to the Conservative Party, increasing the minimum wage by 50p would save the Government an estimated £750m a year through higher tax revenues and lower benefit payments.
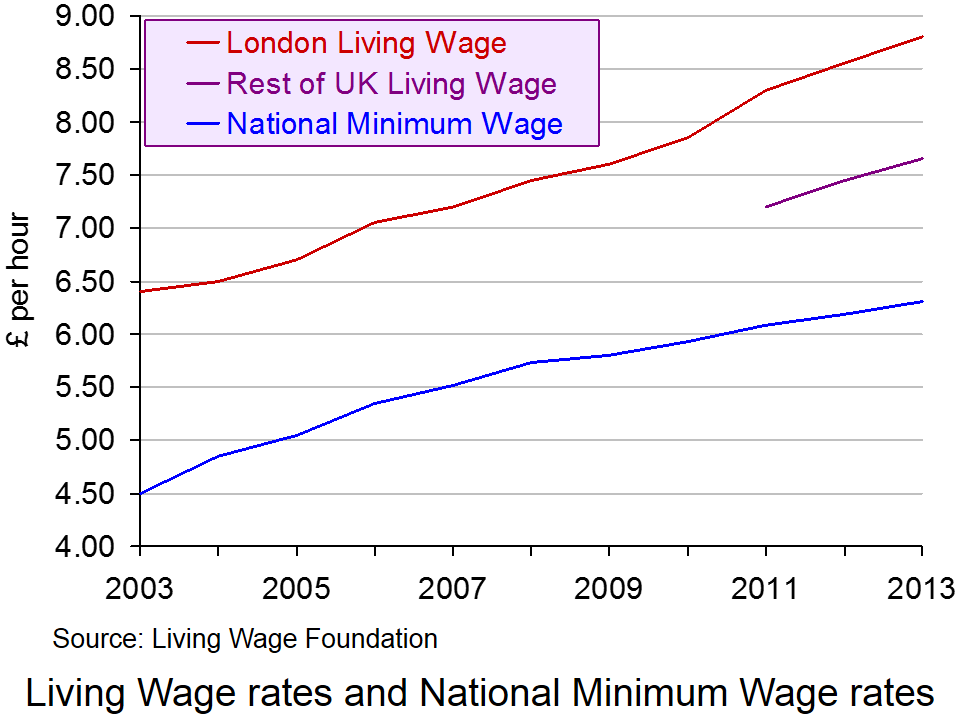 But even such a rise to £6.81 would still leave the minimum wage substantially below the living wage of £8.80 in London and £7.65 in the rest of the UK, as estimated by the Living Wage Foundation (see The cost of a living wage). Although many businesses are now paying at least the living wage, many others, especially small businesses, argue that a rise in the minimum wage above the rate of inflation would force them to consider cutting the number of employees or reducing hours for part-time workers.
Meanwhile, in the USA 13 states have raised their minimum wage rates from the 1st January 2014 (see). Some of the rises, however, were tiny: as little as 15 cents. In a couple of cases, the rise is $1. Currently 21 states and DC have minimum wage rates above the Federal level of $7.25 (approx. £4.40); 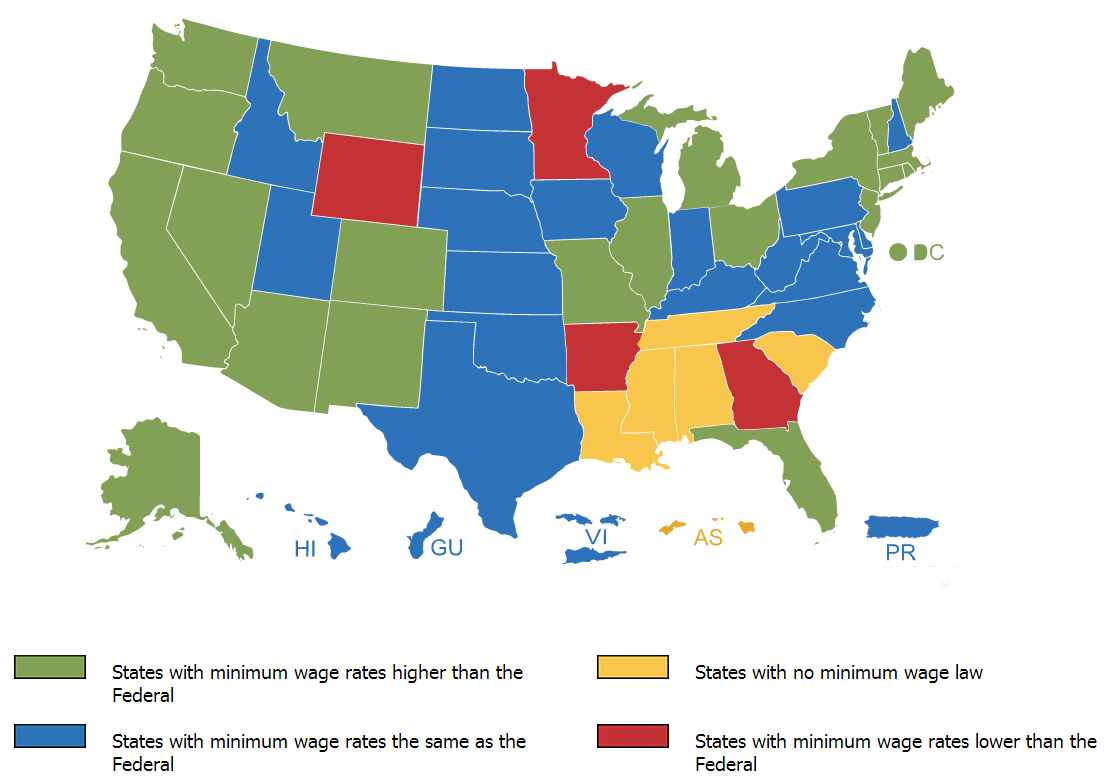 20 states have rates the same as the Federal level; 4 states have rates below the Federal level. At $9.32 per hour, Washington State has the highest state minimum wage; the lowest rates ($5.15) are in Georgia and Wyoming. In 5 states there is no minimum wage at all. As the ABC article below states:
The piecemeal increases at the local level are occurring amidst a national debate over low wages and income inequality. Fast food and retail workers have been staging protests and walking off work for more than a year, calling for better pay and more hours. Currently, fast food workers nationally earn an average of about $9 per hour.
Workers from McDonald’s, Wendy’s, Burger King and other fast food joints are calling for $15 per hour. Wal-Mart workers organizing as part of the union-backed OUR Walmart aren’t asking for a specific dollar amount increase, but they say it’s impossible to live on the wages they currently receive.
President Obama has been throwing his weight behind the issue. Earlier this month, the President said in a speech that it’s “well past the time to raise the minimum wage that in real terms right now is below where it was when Harry Truman was in office.” But such legislation has a bleaker outlook if it reaches the Republican-led House of Representatives. House Speaker John Boehner has said that raising the minimum wage leads to a pullback in hiring.
So what are the costs and benefits of a significant real rise is the minimum wage on either side of the Atlantic? The articles explore the issues.
Articles: UK
Lib Dems accuse Tories of ‘stealing’ their policy as George Osborne prepares to approve above-inflation rise in minimum wage Independent, Andrew Grice (7/1/14)
Lib Dems accuse Tories of ‘nicking’ party’s policy on low wages The Guardian, Nicholas Watt (7/1/14)
Cut housing benefit? A higher minimum wage would help The Guardian, Patrick Collinson (6/1/14)
Miliband prepares to wage war The Scotsman, Andrew Whitaker (8/1/14)
Increasing the minimum wage is only a half answer to poverty New Statesman, Helen Barnard (8/1/14)
Raise the bar: Economically and socially, Britain needs higher wages Independent (7/1/14)
Another Tory says there’s a ‘strong case’ for raising the minimum wage The Spectator, Isabel Hardman (8/1/14)
Fairness and the minimum wage Financial Times (7/1/14)
Osborne wants above-inflation minimum wage rise BBC News (16/1/14)
George Osborne backs minimum wage rise to £7 an hour The Guardian, Nicholas Watt, (16/1/14)
Minimum wage: in his efforts to defeat Labour, Osborne risks mimicking them The Telegraph, Benedict Brogan (16/1/14)
Minimum wage announcement is not just good economics The Guardian, Larry Elliott (16/1/14)
Articles: USA
13 states raising pay for minimum-wage workers USA Today, Paul Davidson (30/12/13)
Minimum wage increase: Wage to rise in 13 states on Jan. 1 ABC15 (30/12/13)
NJ minimum wage sees $1 bump on Jan. 1 Bloomberg Businessweek, Angela Delli Santi (31/12/13)
Minimum wage hike a job killer ctpost, Rick Torres (7/1/14)
A Business Owners Case For Raising The Minimum Wage Grundy Country Herald, David Bolotsky (7/1/14)
Raising the Minimum Wage Isn’t Just Good Politics. It’s Good Economics, Too. New Republic, Noam Scheiber (31/12/13)
Minimum wage rises across 13 US states Financial Times, James Politi (1/1/14)
Information
National Minimum Wage rates GOV.UK
UK minimum wage: a history in numbers Guardian Datablog
List of minimum wages by country Wikipedia
Questions
- Draw two diagrams to demonstrate the direct microeconomic effect of a rise in the minimum wage for two employers, both currently paying the minimum wage, where the first is operating in an otherwise competitive labour market and the other is a monopsonist.
- What is meant by the term ‘efficiency wage rate’? How is the concept relevant to the debate about the effects of raising the minimum wage rate?
- What are the likely macroeconomic effects of raising the minimum wage rate?
- What is the likely impact of raising the minimum wage rate on public finances?
- Is raising the minimum wage rate the best means of tackling poverty? Explain your answer.
 First the good news. Employment is rising and unemployment is falling. Both claimant count rates and Labour Force Survey rates are down. Compared with a year ago, employment is up 279,092 to 29,869,489; LFS unemployment is down from 7.87% to 7.69%; and the claimant count rate is down from 4.7% to 4.0%.
Now the bad news. Even though more people are in employment, real wages have fallen. In other words, nominal wages have risen less fast than prices. Since 2009, real wages have fallen by 7.6% and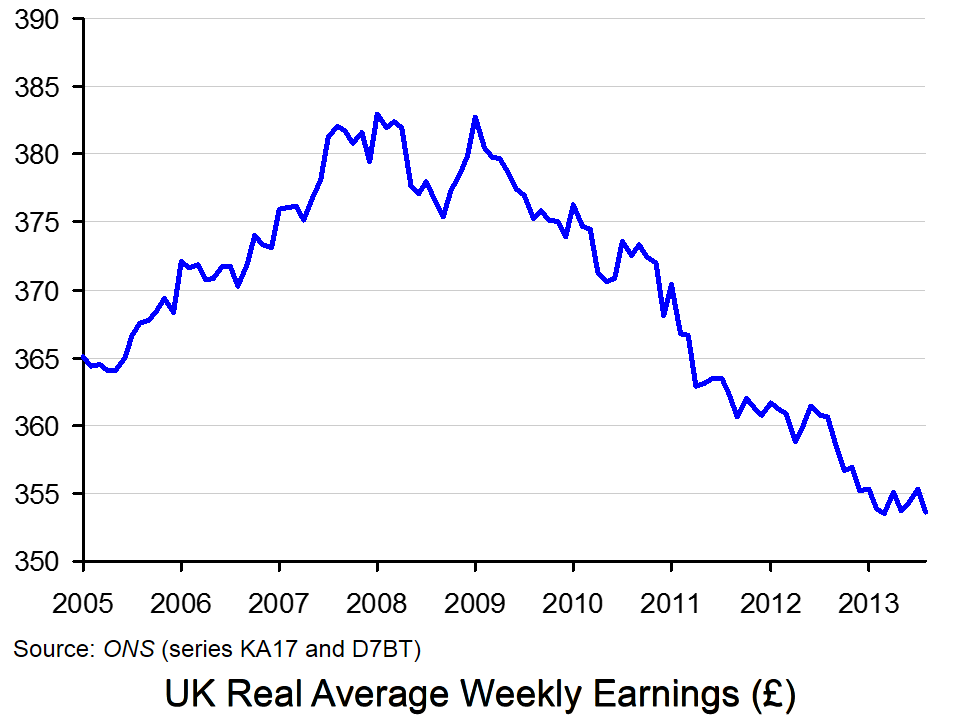 have continued to fall throughout this period. The first chart illustrates this. It shows average weekly wage rates in 2005 prices. (Click here for a PowerPoint of the chart.)
The fall in real wages is an average for the whole country. Many people, especially those on low incomes, have seen their real wages fall much faster than the average. For many there is a real ‘cost of living’ crisis.
But why have real wages fallen despite the rise in employment? The answer is that output per hour worked has declined. This is illustrated in the second chart, which compares UK output per worker with that of other G7 countries. UK productivity has fallen both absolutely and relative to other G7 countries, most of which have had higher rates of investment.
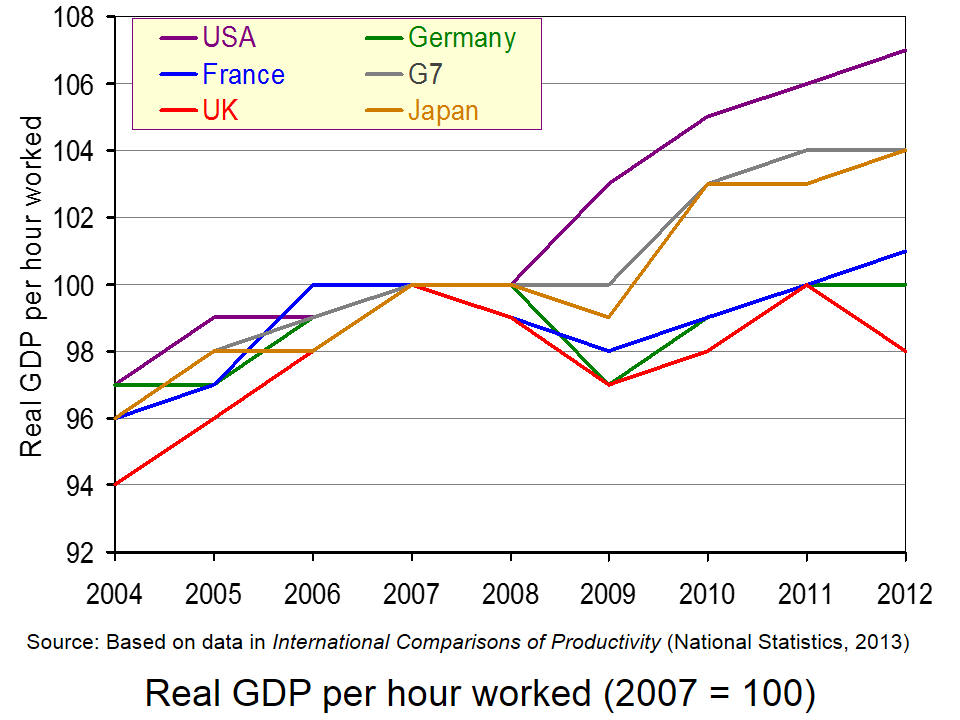 The falling productivity in the UK requires more people to be employed to produce the same level of output. Part of what seems to be happening is that many employers have been prepared to keep workers on in return for lower real wages, even if demand from their customers is falling. And many workers have been prepared to accept real wage cuts in return for keeping their jobs.
Another part of the explanation is that the jobs that have been created have been largely in low-skilled, low-wage sectors of the economy, such as retailing and other parts of the service sector.
But falling productivity is only part of the reason for falling real wages. The other part is rising prices. A number of factors have contributed to this. These include a depreciation of the exchange rate back in 2008, the effects of which took some time to filter through into higher prices in the shops; a large rise in various commodity prices; and a rise in VAT and various other administered prices.
So what is the answer to falling real wages? The articles below consider the problem and some of the possible policy alternatives.
Articles
Inflation, unemployment and UK ‘misery’ BBC News, Linda Yueh (16/10/13)
Employment is growing, but so are the wage slaves The Guardian, Larry Elliott (16/10/13)
Living standards – going down and, er, up BBC News, Nick Robinson (26/7/13)
Revealed: The cost of living is rising faster in the UK than anywhere in Europe, with soaring food and energy bills blamed Mail Online, Matt Chorley (16/10/13)
Cutting prices to raise living standards is just a waste of energy The Telegraph, Roger Bootle (6/10/13)
Downturn sees average real wages collapse to a record low Independent, Ben Chu (17/10/13)
Why living standards and public finances matter Financial Times, Gavin Kelly (29/9/13)
Social Mobility Tsar Alan Milburn Calls on Government to Boost Wages to End UK Child Poverty International Business Times, Ian Silvera (17/10/13)
Do incorrect employment growth figures explain low UK productivity? The Guardian, Katie Allen (23/10/13)
Data
Unemployment data ONS
Average Weekly Earnings dataset ONS
Consumer Prices Index ONS
International Comparison of Productivity ONS
Questions
- How are real wages measured?
- Why have real wage rates fallen in the UK since 2009?
- What factors should be included when measuring living standards?
- Why has employment risen and unemployment fallen over the past two years?
- What factors could lead to a rise in real wages in the future?
- What government policies could be adopted to raise real wages?
- Assess these policies in terms of their likely short-term success and long-term sustainability.
 In a post last August we looked at the rising number of workers employed on ‘zero-hours’ contracts. These are contracts where there are no guaranteed minimum hours. Such contracts give employers the flexibility to employ workers as much or as little as suits the business. Sometimes it benefits workers, who might be given the flexibility to request the hours that suit them, but usually workers simply have to take the hours on offer.