 UK house prices are incredibly volatile. This helps to explain the fascination that many of us have with the British housing market. According to the latest ONS house Price Index, the average UK house price in August 2013 was 3.8 per cent higher than 12 months earlier. The rates varied across the home nations: 4.1 per cent in England, 1.1 per cent in Northern Ireland, 1 per cent in Wales and -0.7 per cent in Scotland. Here we take a look at international house price inflation rates. Is the British housing market as unique as we think it is?
Let’s begin at home (excuse the pun). If we take the period from 1970 Q1 to 2013 Q2, the average annual rate of house price inflation across the UK is 9.7 per cent. The average rate in England is 9.8 per cent, as it is in Wales too, while in Scotland it is 9.0 per cent and in Northern Ireland it is 8.8 per cent. While the long-term averages of the UK nations are rather more similar than perhaps we might expect, what is quite interesting is the differences that emerge in more recent times. If we take the period from July 2008 to August 2013, the average annual rate of house price inflation in the UK is -0.2 per cent, in England it is 0.1 per cent, in both Wales and Scotland it is -1.0 per cent, while in Northern Ireland it is -11 per cent.
The recent English average is heavily distorted by London and to a lesser extent the rest of the South East. In London and the South East the average annual house price inflation rates since July 2008 have been 2.6 per cent and 0.2 per cent respectively. In all the other English regions the average rate has been negative. In my own region of the East Midlands the average rate has been -1.2 per cent – this is exactly the UK average if both London and the South East are removed from the figures.
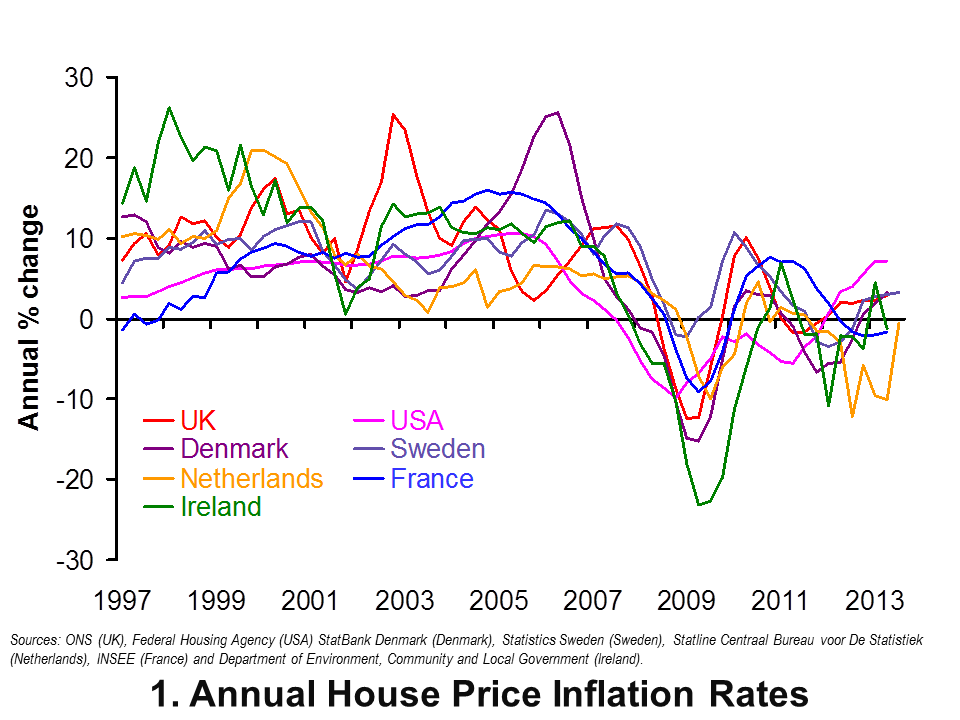 Now let’s go international. Chart 1 shows annual house price inflation rates for the UK and six other countries since 1997. Interestingly, it shows that house price volatility is a common feature of housing markets. It is not a uniquely British thing. It also shows that the USA is notable for its relatively robust house price inflation rates of late. In the first half of 2013 annual house price inflation has been running at 7 per cent in America, compared with 2 to 3 per cent here in the UK. In contrast, the Netherlands has seen near-double digit rates of house price deflation over the past year, albeit with a rebound in the third quarter of this year. (Click here to download a PowerPoint of the chart.)
The chart captures very nicely the effect of the financial crisis and subsequent economic downturn on global house prices. Ireland saw annual rates of house price deflation touch 23 per cent in 2009 compared with rates of deflation of 12 per cent in the UK. Denmark too suffered significant house price deflation with prices falling at an annual rate of 15 per cent in 2009.
House price volatility appears to be an inherent characteristic of housing markets worldwide. Let’s now consider the extent to which house prices rise over the longer term. In doing so, we consider real house price growth after having stripped out the effect of consumer price inflation. Real house price growth measures the growth of house prices relative to consumer prices.
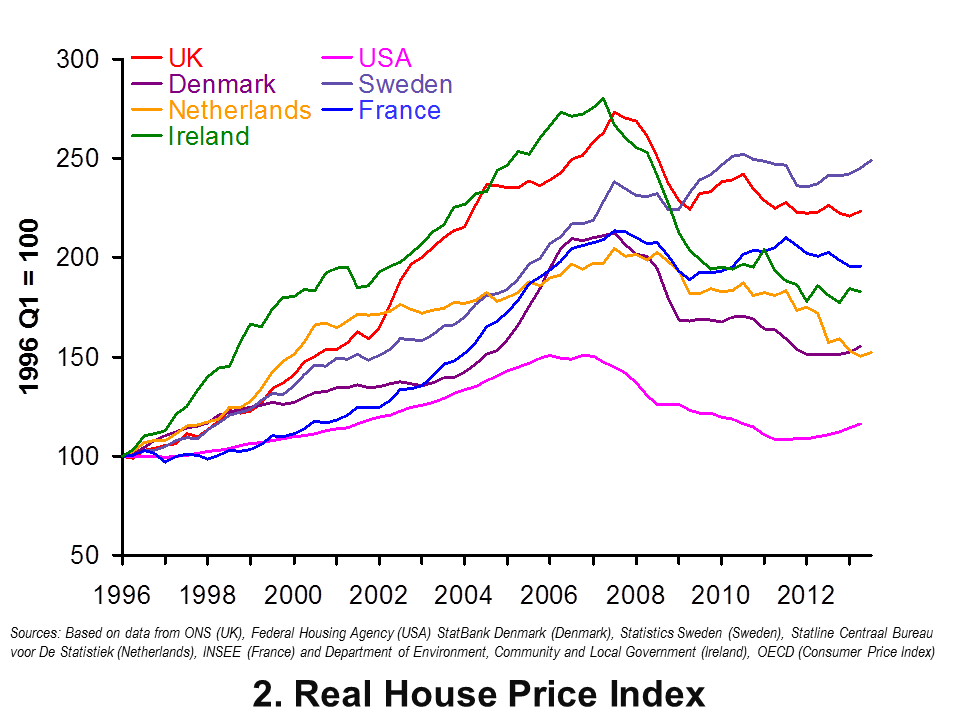 Chart 2 shows real house prices since 1996 Q1. (Click here to download a PowerPoint of the chart.) It shows that up to 2013 Q2, real house prices in the UK have risen by a factor of 2.24, i.e. they are two and a quarter times higher. This is a little less than in Sweden where prices are 2.5 times higher.
Chart 2 shows that the increase in real house prices in the UK and Sweden is significantly higher than in the other countries in the sample. In particular, in the USA real house prices in 2013 Q2 are only 1.16 times higher than in 1996 Q1. In the US actual house prices, when viewed over the past 17 years or so, have grown only a little more quickly than consumer prices.
The latest data on house prices suggest that house price volatility is not unique to the UK. However the rate of growth over the longer term relative to consumer prices is markedly quicker than in many other countries. It is this which helps to explain the amount of attention paid to the UK housing market – and not least by policy-makers.
Data
House Price Indices: Data Tables Office for National Statistics
Articles
First time buyers in race to beat house price rises Telegraph, Nicole Blackmore (8/11/13)
House prices soar by £13,000: Values rise at fastest rate for 3 years Express, Sarah O’Grady (7/11/13)
House prices: ‘south-east set to outpace London’ for first time in a decade Guardian, Jennifer Rankin (6/11/13)
UK house prices hit record level, says ONS BBC News, (15/10/13)
UK house prices rise at fastest pace in three years in October – Nationwide Reuter (31/11/13)
 Jonathan Portes: UK house prices a ‘force of evil’ BBC News, (5/11/13)
Questions
- What is meant by the annual rate of house price inflation? What about the annual rate of house price deflation?
- What factors are likely to affect housing demand?
- What factors are likely to affect housing supply?
- Explain the difference between nominal and real house prices. What does a real increase in house prices mean?
- How might we explain the recent differences between house price inflation rates in London and the South East relative to the rest of the UK?
- What might explain the very different long-term growth rates in real house prices in the USA and the UK?
- Why were house prices so affected by the financial crisis?
- What factors help explain the volatility in house prices?
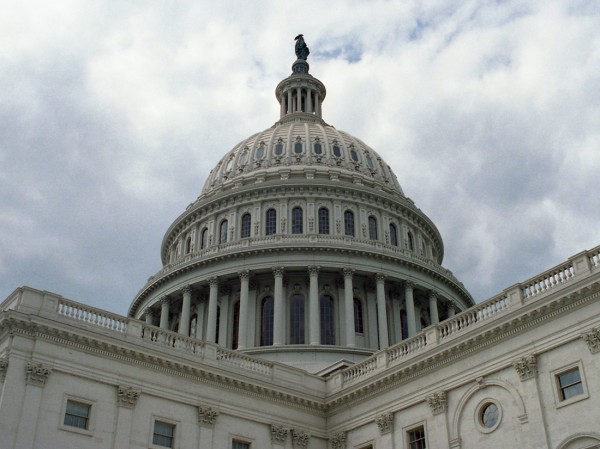 You may have been following the posts on the US debt ceiling and budget crisis: Over the cliff and Over the cliff: an update. Well, after considerable brinkmanship over the past couple of weeks, and with the government in partial shutdown since 1 October thanks to no budget being passed, a deal was finally agreed by both Houses of Congress, less than 12 hours before the deadline of 17 October. This is the date when the USA would have bumped up against the debt ceiling of $16.699 trillion and would be in default – unable to borrow sufficient funds to pay its bills, including maturing debt.
But the deal only delays the problem of a deeply divided Congress, with the Republican majority on the House of Representatives only willing to make a long-term agreement in exchange for concessions by President Obama and the Democrats on the healthcare reform legislation. All that has been agreed is to suspend the debt ceiling until 7 February 2014 and fund government until 15 January 2014.
A more permanent solution is clearly needed: not just one that raises the debt ceiling before the next deadline, but one which avoids such problems in the future. Such concerns were echoed by Christine Lagarde, Managing Director of the International Monetary Fund (IMF), who issued the following statement:
The U.S. Congress has taken an important and necessary step by ending the partial shutdown of the federal government and lifting the debt ceiling, which enables the government to continue its operations without disruption for the next few months while budget negotiations continue to unfold.
It will be essential to reduce uncertainty surrounding the conduct of fiscal policy by raising the debt limit in a more durable manner. We also continue to encourage the U.S. to approve a budget for 2014 and replace the sequester with gradually phased-in measures that would not harm the recovery, and to adopt a balanced and comprehensive medium-term fiscal plan.
US default: Congress votes to end shutdown crisis The Telegraph, Raf Sanchez (17/10/13)
US shutdown: Christine Lagarde calls for stability after debt crisis is averted The Guardian,
James Meikle, Paul Lewis and Dan Roberts (17/10/13)
America’s economy: Meh ceiling? The Economist (15/10/13)
Relief as US approves debt deal BBC News (17/10/13)
Shares in Europe dip after US debt deal BBC News (17/10/13)
Dollar slides as relief at U.S. debt deal fades Reuters, Richard Hubbard (17/10/13)
US debt deal: Analysts relieved rather than celebrating Financial Times, John Aglionby and Josh Noble (17/10/13)
Greenspan fears US government set for more debt stalemate BBC News (21/10/13)
Questions
- Explain what is meant by default and how the concept applies to the USA if it had not suspended or raised its budget ceiling.
- Is the agreement of October 16 likely to ‘reassure markets’? Explain your reasoning.
- What is likely to happen to long-term interest rates as a result of the agreement?
- Will the imposition of a new debt ceiling by February 2014 remove the possibility of using fiscal policy to stimulate aggregate demand and speed up the recovery?
- What is meant by ‘buy the rumour, sell the news’ in the context of stock markets? How was this relevant to the agreement on the US debt ceiling and budget?
 In a News Item of 1 October, Over the Cliff, we looked at the passing of the deadline that same day for Congress to agree a budget. We also looked at the looming deadline for Congress to agree a new higher ceiling for Federal Government debt, currently standing at $16.699 trillion. Without an agreement to raise the limit, the government will start becoming unable to pay some of its bills from around 17 October.
One week on and no agreement has been reached on either a budget or a higher debt ceiling.
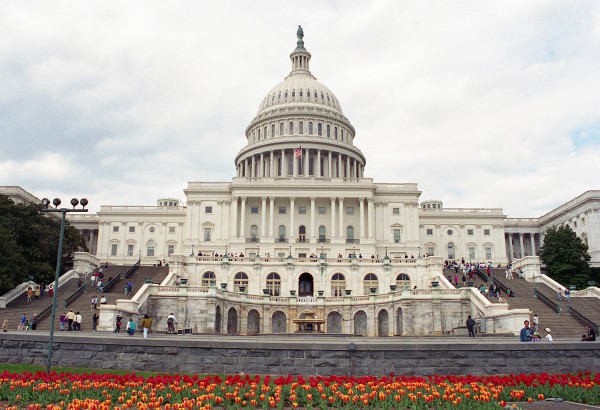 Failure to agree on a budget has led to the ‘shut-down’ of government. Only essential services are being maintained; the rest are no longer functioning and workers have been sent home on ‘unpaid leave’. This has led to considerable hardship for many in the USA. It has had little effect, however, on the rest of the world, except for tourists to the USA being unable to visit various national parks and monuments.
Failure to raise the debt ceiling, however, could have profound consequences for the rest of the world. It could have large and adverse effects of global growth, global trade, global investment and global financial markets. The articles below explore some of these consequences.
U.S. Congress enters crucial week in budget, debt limit battles Reuters, Richard Cowan (7/10/13)
Debt ceiling: Understanding what’s at stake CBS Moneywatch, Alain Sherter (7/10/13)
Q&A: What is the US debt ceiling? BBC News, Ben Morris (3/10/13)
Five Reasons to Fear the Debt Ceiling Bloomberg (6/10/13)
A U.S. Default Seen as Catastrophe Dwarfing Lehma Bloomberg Businessweek, Yalman Onaran (6/10/13)
China tells US to avoid debt crisis for sake of global economy BBC News (7/10/13)
US shutdown is starting to hit business, says Commerce Secretary BBC News (6/10/13)
Why Australia should fear a US government default The Guardian, Greg Jericho (7/10/13)
Could the US default over just $6bn? BBC News, Linda Yueh (11/10/13)
IMF piles pressure on US to reconcile differences and prevent debt default The Guardian, Larry Elliott and Jill Treanor (10/10/13)
Republicans offer to raise US debt ceiling for six weeks The Telegraph, Peter Foster and Raf Sanchez (11/10/13)
Questions
- If a debt ceiling is reached, what does this imply for the budget deficit?
- How serious are the two current fiscal cliffs?
- How would a continuation of the partial government shut-down impact on the US private sector?
- What multiplier effects on the rest of the world are likely to arise from a cut in US government expenditure or a rise in taxes? What determines the size of these multiplier effects?
- Explain the likely effect of the current crisis on the exchange rate of the dollar into other currencies.
- Why might the looming problem of reaching the debt ceiling drive up long-term interest rates in the USA and beyond?
For the second time in nine months, the USA has approached a fiscal cliff. This is where the federal government is forced to make government expenditure cuts and/or impose tax rises. There are two types of cliff face. The first is a legal limit on the size of the federal government debt and hence deficit. The second is failure to agree on a budget.
On January 1st this year, a fiscal cliff was narrowly averted by a last-minute agreement to raise the size of the permitted debt. On the 1st October (the beginning of the financial year), however, the US economy ‘fell over the cliff’. This time is was a failure by Congress to reach agreement over the federal budget. The sticking point was an unwillingness of the Republican majority in the House of Representatives to agree to a budget without the government making concessions on its healthcare reform. The government was unwilling to do that and so no budget was passed.
With no budget, much of government has to shut down! In practice, this means that all non-essential workers will cease to be paid. That includes workers in housing, parts of healthcare, the civil law part of the justice system, immigration, regulatory agencies, the passport service, parks and museums. Even workers in essential areas, such as civilian workers in the military, police and social services, are likely to see their pay delayed until the problem is resolved. The articles below look at some of the implications of this partial shut-down.
It is hoped that, within a few days, agreement on a budget will be reached. But that will not be the end of the story because a second fiscal cliff looms. And that is of the first type. There is currently a legal limit to Federal Government debt of $16.699 trillion. Because that limit was reached earlier this year, from May 18 the government has been able to use various ‘extraordinary measures‘ to carry on borrowing. These measures will run out, however, around 17 October. From then, if a new higher debt ceiling has not been agreed by Congress, the government will be unable to pay some of its bills. For example, on 1 November it will get a bill of $67billion for social security, medicare and veterans benefits. As the second Independent article below explains:
In a government shutdown, the federal government is not allowed to make any new spending commitments. By contrast, if we hit the debt-ceiling then the Treasury Department won’t be able to borrow money to pay for spending that Congress has already approved. In that case, either Congress will have to lift the debt ceiling or the federal government will have to default on some of its bills, possibly including payments to bondholders or Social Security payouts. That could trigger big disruptions in the financial markets — or a long-term rise in borrowing costs.
Not surprisingly, financial markets are nervous. Although the direct effect of lost output will be relatively small, provided agreements on the budget and the debt are reached fairly soon, the impact on confidence in the US system of government could be more damaging. Not only could this curb recovery in the USA, it could have a significant effect on global recovery, given the size and importance of the US economy to the rest of the world.
Webcasts
What does the shutdown mean for normal Americans? BBC News, Keith Doyle (1/10/13)
How the government shut down is being reported in the US BBC News (1/10/13)
Shutdown could slam frail U.S. economy Reuters, Bobbi Rebell (1/10/13)
Shutdown Will Cost U.S. Economy $300 Million a Day, IHS Says Bloomberg, Jeanna Smialek & Ian Katz (1/10/13)
How will the US government shutdown affect the global economy? The Guardian, Larry Elliott and Guy Grandjean (1/10/13)
How would a government shutdown affect the rebounding economy? Aljazeera, Duarte Geraldino (30/9/13)
How will the US government shutdown affect the economy? BBC News, Richard Lister (1/10/13)
Shutdown continues as Obama and Republicans fail to agree BBC News, Rajini Vaidynathan (2/10/13)
Former US Secretary of Labor Robert Reich on shutdown BBC News, Robert Reich (2/10/13)
Government shutdown: What’s the cost? CBS News, Rebecca Kaplan (1/10/13)
US shutdown will have ‘minimal impact’ on global economy One News (New Zealand), Dan Zirker (2/10/13)
What is the US debt ceiling? BBC News, Hugh Pym (14/10/13)
Articles
US wakes up to government shutdown as Congress fails to strike budget deal Independent, Nikhil Kumar (1/10/13)
US begins government shutdown as budget deadline passes BBC News (1/10/13)
David Cameron warns on world growth as US government shuts down The Telegraph, Damien McElroy (1/10/13)
Shutdown showdown: A glossary Aljazeera, Ben Piven (30/9/13)
Everything you need to know about how the partial shutdown will work in US Independent, Brad Plumer (1/10/13)
What’s the economic impact of a US government shutdown? BBC News, Kim Gittleson (1/10/13) (follow links at top of screen for further articles)
US government shutdown isn’t the worst of it BBC News, Linda Yueh (30/9/13)
Onset of the storm BBC News, Robert Peston (1/10/13)
The gathering storm? BBC News, Robert Peston (30/9/13)
Government shutdown: what’s really going on – and who’s to blame? The Guardian, Dan Roberts (30/9/13)
Government shutdown threat is getting very old, very fast CNN, Julian Zelizer (30/9/13)
US fiscal cliff fears rattle the markets The Australian, Adam Creighton (1/10/13)
U.S. Government Shutdown Sinks Dollar Forbes, Dean Popplewell (1/10/13)
US Government Shutdown: European Markets Not Fretting Over Temporary Closure International Business Times, Ishaq Siddiqi (1/10/13)
The States to plunge into abyss of debt, off fiscal cliff Pravda, Irina Sabinina (1/10/13)
Shutting down the United States government nothing new The Vancouver Sun, Andrew Coyne (1/10/13)
Christine Lagarde urges US that debt crisis threatens world economy The Guardian, Larry Elliott (3/10/13)
U.S. failure to lift debt ceiling could damage world – IMF Reuters (3/10/13)
Data
US government shutdown: in numbers The Guardian (see also)
US Budget: Historical Tables White House Office of Management and Budget (includes estimates to 2018 as well as historical data)
Questions
- If a debt ceiling is reached, what does this imply for the budget deficit?
- How serious are the two current fiscal cliffs?
- How would a continuation of the partial government shut-down impact on the US private sector?
- What multiplier effects on the rest of the world are likely to arise from a cut in US government expenditure or a rise in taxes? What determines the size of these multiplier effects?
- Explain the likely effect of the current crisis on the exchange rate of the dollar into other currencies.
- Why might the looming problem of reaching the debt ceiling drive up long-term interest rates in the USA and beyond?
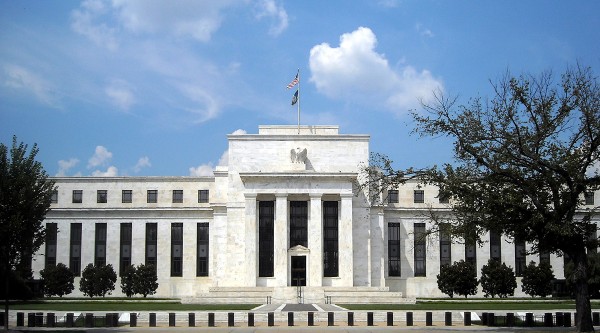 As we saw in the news item The difficult exit from cheap money, central banks around the world have been operating an extremely loose monetary policy since the beginning of 2009. Their interest rates have been close to zero and trillions of dollars of extra money has been injected into the world economy through various programmes of quantitative easing.
For the past few months the Federal Reserve has been purchasing bonds under its most recent programme dubbed QE3, and thereby increasing narrow money, by $85 billion per month. Since the start of its QE programme in 2009, it has pumped around $2.8 trillion of extra money into the US and world economies. This huge increase in money supply has boosted the demand for assets worldwide and world stock markets have risen. Much of the money has flowed into developing countries, such as India, and has acted as a boost to their economies.
 Once the US economy is growing strongly again, the aim is to taper off, and ultimately end or even reverse, the QE programme. It was expected that the Fed would decide to start this tapering off process at its meeting on 18 September – perhaps reducing bond purchases initially by some $10 billion. (Note that this would still be an increase in money supply, just a slightly smaller one.) Over the past few days, US bond prices have been falling (and yields increasing) in anticipation of such a move.
As it turned out, the Fed decided to delay tapering off. It will continue with its assets purchase programme of $85 billion per month for the time being. The reason given was that the US economy was still too fragile and needed the monthly injections of money to stay at the current level.
Normally it might be expected that the announcement of a more fragile recovery would cause the US stock market, and others worldwide, to fall. In fact the opposite occurred, with investors relieved that the extra money, which allows extra asset purchases, would continue at the same rate.
But this then raises the question of just what will be the effect when tapering off does actually occur. Will stock markets then go into a tailspin? Or will they merely stop rising so fast. That depends very much on the role of speculation.
Webcasts
Bernanke’s Own Words on Asset Purchases, Economy Bloomberg (18/9/13)
Bernanke: Fed to delay bond tapering PBS Newshour on YouTube (full speech plus questions) (18/9/13)
No tapering announced by Fed CNBC on Yahoo Finance (18/9/113)
The impact of US stimulus moves at home and abroad BBC News, Stephanie Flanders (18/9/13)
Is the upturn reaching Americans? BBC World, Stephanie Flanders (17/9/13)
Shares hit high as Federal Reserve maintains stimulus BBC News, Stephanie Flanders (18/9/13)
US Fed decision to delay tapering was a relief ET Now (India), Bimal Jalan (19/9/13)
Articles
Federal Reserve surprises markets by delaying QE tapering The Telegraph, Katherine Rushton (18/9/13)
Federal Reserve delays QE tapering: the full statement The Telegraph (18/9/13)
Q&A: What is tapering? BBC News (18/9/13)
Fed delay is no reason to celebrate The Guardian, Larry Elliott (19/9/13)
Federal Reserve tapering decision has baffled the markets The Guardian, Larry Elliott (19/9/13)
Taper tiger The Economist (21/9/13)
Everything You Need to Know About the Fed’s Decision Not to Taper QE3 The Atlantic, Matthew O’Brien (18/9/13)
Fed’s dovish turn leaves Wall Street economists mulling taper timing: poll Reuters, Chris Reese (18/9/13)
Good news and bad news from the Fed BBC News, Stephanie Flanders (19/9/13)
Is the Fed frightened of its shadow? BBC News, Robert Peston (19/9/13)
The Federal Reserve and Janet Yellen face a tough task with insufficient tools The Guardian, Mohamed A. El-Erian (14/10/13)
Questions
- Why might a slowing down in the increase in US money supply cause asset prices to fall, rather than merely to rise less quickly?
- Why has the US QE programme led to a rise in asset prices overseas?
- Distinguish between stabilising and destabilising speculation. Which type of speculation has been occurring as a result of the US QE programme?
- How has QE affected unemployment in the UK and USA? How is the participation rate and the flexibility of labour markets relevant to the answer?
- Explain the following two statements by Stephanie Flanders and Robert Peston respectively. “The market conditions argument has a circularity to it: talk of tapering leads to higher market rates, which in turn puts the taper itself on hold.” “The Fed simply hinting that less money would be created, means that there will be no reduction in the amount of money created (for now at least).”
- Why have US long-term interest rates, including mortgage rates, risen since May of this year?
- What impact have higher US long-term interest rates had on economies in the developing world? Explain.